Newsletter
Issue 37, October/November 2022 | www.scientificbeta.com
![]()
![]()
Bridging the Gap between Academia and Industry
Inflation Features

A focus on Scientific Beta's latest research.
Targeting Inflation Risk in Equity Investing: Building Dedicated Portfolios from Robust Exposures
Targeting Inflation Risk in Equity Investing: Building Dedicated Portfolios from Robust Exposures
We measure the inflation exposure of stocks using robust measures of return sensitivities in combination with automated analysis of risk disclosure texts. Reliable measurement requires forward-looking measures that reflect market participants' surprises with respect to inflation. Investors need to build dedicated portfolios to effectively target inflation exposure. Allocating across off-the-shelf building blocks, like sector indices or style factors, is too imprecise to deliver reliable results. Our approach can be used to design equity indices that protect investors from inflation surprises.
Introduction
Investors care how their equity portfolio is exposed to inflation risk. They are typically affected by inflation shocks outside their equity portfolio and wish to avoid dialling up such exposure when it comes to their equity investments. In addition, investment organisations spend significant resources to form views on future inflation. They need tools to translate these views into decisions about their equity portfolio.
This article presents a methodology developed in Esakia and Goltz (2022) that allows equity portfolios that target inflation exposure in the desired direction to be built, protecting investors from either positive or negative inflation shocks. We first discuss how to measure and target inflation exposures and then evaluate the out-of-sample reliability of this approach.
How to obtain a reliable measure of macro exposure
It has been documented that equity portfolios have substantial exposures to macroeconomic risks. In Amenc et al. (2019), we analysed equity style factors and found that they did show substantial differences in their long-term exposures to different macroeconomic variables, after accounting for their exposure to the equity market factor. However, measuring these exposures reliably out-of-sample is not a piece of cake. Ang, Briere and Signori (2012) found that portfolios of stocks with the highest in-sample exposure to inflation could not provide any protection against inflation when going out-of-sample. In Esakia and Goltz (2022), we introduce an approach that allows exposures to a variety of macroeconomic state variables to be measured and portfolio exposure to such macro variables to be targeted. This approach relies on four important ingredients discussed below.
Selecting forward-looking variables
As explained in Amenc et al. (2019) and Esakia and Goltz (2022), using realised quantities of fundamental economic measures are not suited when analysing movements in asset prices. In liquid markets, information is quickly reflected in prices. Financial assets that are claims for future cash-flows depend on investors' expectations going forward. Therefore, looking at past realisations of economic variables does not allow the relationship between asset prices and economic conditions to be captured reliably. This is why we rely on macro state variables that are forward-looking and that incorporate available information fast. We primarily rely on nominal and inflation-protected bonds data from the United States. In particular, we use the difference between yields in 10-year Treasury Inflation-Protected Securities (TIPS) and 10-year nominal Treasury bonds. This measure is also called breakeven inflation, and it reflects the market expectations about long-term inflation. Our approach can be easily extended to other geographical areas and macro variables.
Surprises matter, not levels!
Another very important aspect of our methodology is to use surprises, or innovations, in expected inflation instead of levels. The value of stocks is not formally linked to the realisation of inflation, as opposed to inflation-linked bonds. Investors do not know what realised inflation will be in the future. The value of assets will reflect information that is known to investors today. As new information arrives, asset prices, including the stocks, will adjust accordingly. This is why we are interested in surprises, since the level of expected inflation that was fully anticipated by investors will not lead to different price reactions across stocks. Therefore, we will be measuring stocks' sensitivity to surprises in expected inflation, rather than levels of expected inflation.
To estimate anticipated changes in inflation, the standard approach is to use the vector auto-regressive model or VAR (see Campbell (1996), Petkova (2006) and Boons (2016)). A simpler approach is to use the first-order differences in a given macro variable. We choose first-order differences because in our setting it leads to similar results to using a VAR.
Robust statistical estimates
We take several important steps to ensure that exposures estimated on past data stay reliable out-of-sample.
First, we use weekly frequency of observations. Levi and Welch (2017) show that using such higher-frequency data provides substantial improvements in accuracy of estimated betas compared to using monthly returns data. Having higher frequency leads to more observations, which helps to reduce estimation error. Therefore, we use weekly observations to estimate macro exposures with greater accuracy.
Second, we account for recent dynamics in macro betas while maintaining deep historical samples for estimation. Estimation problems face a basic trade-off between sample size and responsiveness to changes in exposures. Using historical data that is a decade old provides a large sample but ignores that firms might have drastically changed over this period. On the other hand, relying on a short time window, such as only the most recent year, will lead to imprecise estimates due to small sample size. We overcome this trade-off by using a long-term history of stock-level returns (20 years, if available) and attributing decreasing importance to observations as we go further back into history.
Third, we explicitly account for estimation risk at the firm-level. Treating inflation exposures of identical magnitude for two stocks as equal would ignore estimation risk. Even if macro betas for two stocks are estimated to be identical in magnitude, they may differ in terms of the uncertainty around the point estimate. Therefore, we also account for the differences in uncertainty across stocks and adjust inflation exposures that are estimated imprecisely.
Text-based measure of macro exposures
Stock returns are noisy, and it is practically impossible to disentangle all their determinants. While our statistical approach does its best to capture the sensitivity of stock returns to inflation surprises, it still has obvious limitations. Therefore, we go beyond returns and look for additional information to further improve the out-of-sample reliability of our inflation exposures. We do this by complementing our statistical estimates of macro exposures with the information from text data.
More specifically, we rely on the "Risk Factors" section of firms' annual 10-K filings that have been mandatory to disclose for public US firms since 20061. The "Risk Factors" section should mention all key risk factors that may affect the firm. We use natural language processing techniques to come up with a score that indicates how important inflation risk is for a given firm. These techniques exploit the insight that the more often a given risk is discussed, the more likely it is that the firm is exposed to this risk. We use the text-based measures of exposures to complement the statistical measures when ranking stocks in our equity universe.
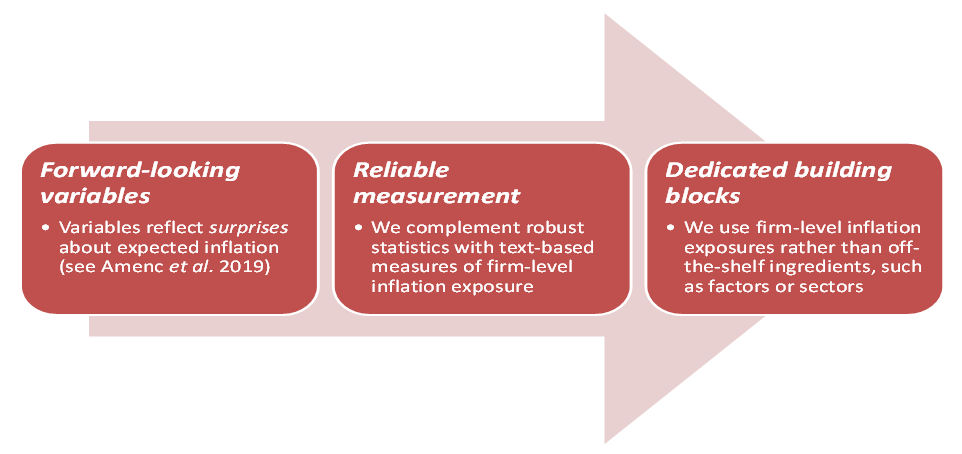
Overview of how we measure inflation exposure
Exhibit 1 summarises the process. The first ingredient of our methodology is to use surprises in forward-looking variables, such as breakeven inflation2. Second, we use a combination of statistical and text-based measures to define the stock-level macro exposures. Statistical estimates rely on surprises in forward-looking macro variables and employ various statistical adjustments to generate robust estimates. Text-based analysis allows us to add information beyond historical returns. Finally, we use stock-level inflation exposures to create dedicated building blocks instead of allocating across existing ingredients, such as sector or factor portfolios.
Exhibit 1: Process for Creating Macro Exposure Portfolios
Assessing the reliability of macro exposure estimates
We evaluate the reliability of macro exposure estimates by constructing mimicking portfolios. We buy stocks with the highest exposures to inflation (top 20%) and sell ones with the lowest inflation exposure estimates (bottom 20%). The equal-weighted long-short portfolio is formed each quarter and held until the next quarterly rebalancing. If our ex-ante estimates of exposure are reliable, the mimicking portfolio will have positive exposure ex-post.
It is worth highlighting the importance of using forward-looking variables. Exhibit 2 reports the realised macro betas of different macro variables using a naïve estimation technique (ordinary least-squares estimates on monthly returns over the most recent 5 years). The mimicking portfolios have both statistically and economically weak exposures out-of-sample. The results suggest that mimicking portfolios formed on backward looking variables do not come with positive exposure out-of-sample.
Exhibit 2: Out-of-Sample Exposures when Using Different Macro Variables
United States
30/06/1970 – 30/06/2022 |
Realised Macro Beta |
T-statistic |
| Using Backward-Looking Variable and Naïve Estimation Techniques | ||
| Industrial Production | -0.08 |
-0.67 |
| CPI | 0.28 |
0.78 |
The realised macro exposures are estimated in a bivariate regression that includes the market factor and the corresponding macro variable. Standard errors are adjusted for heteroskedasticity and autocorrelation following Newey-West (1987). We follow Andrews (1991) when determining data-dependent bandwidth/lag truncation parameters, which are estimated in a first-order autoregressive model (AR(1)) with a maximum likelihood method.
We now turn to analysing mimicking portfolios that use our robust statistical procedure complemented with textual analysis. Exhibit 3 highlights two important findings. First, using robust estimation techniques leads to significant improvements in realised exposures compared to the naïve estimation approach. The beta of a mimicking portfolio using a robust estimation is 4.48, which is statistically significant. Recall that when using a naïve approach, we could only achieve insignificant beta of 1.89, as reported in the second row of Exhibit 3. Secondly, even when relying on robust estimation techniques, using levels in expected inflation does not lead to reliable results. The last row of Exhibit 3 shows that a mimicking portfolio that uses levels of expected inflation comes with negative out-of-sample exposure, albeit statistically insignificant. This finding is reassuring since the level of expected inflation is less relevant for asset prices than surprises.
Exhibit 3: Out-of-Sample Exposure to Breakeven Inflation with Different Estimation Approaches
United States
31/03/2002 – 30/06/2022 |
Realised Macro Beta |
T-statistic |
| Breakeven Inflation Surprises (Robust Estimation) | 4.48 |
2.73 |
| Breakeven Inflation Surprises (Naïve Estimation) | 1.89 |
1.26 |
| Breakeven Inflation Level (Robust Estimation) | -0.04 |
-0.32 |
The realised exposures are estimated to the same variable that was used during the estimation. Levels refer to absolute values of breakeven inflation, surprises refer to innovations over a lag of one period. Robust measurement uses weekly frequency, weighted least-squares, 20-year calibration window, Bayesian shrinkage; and complements this with textual analysis. Naïve measurement uses monthly data, ordinary least squares, and a 5-year calibration window. Standard errors are adjusted for heteroskedasticity and autocorrelation following Newey-West (1987). We follow Andrews (1991) when determining data-dependent bandwidth/lag truncation parameters, which are estimated in a first-order autoregressive model (AR(1)) with a maximum likelihood method.
To summarise, using naïve estimation techniques or using the level of inflation leads to failure to measure exposures reliably. In contrast, applying robust estimation to surprises in BEI leads to exposures that remain reliable out-of-sample.
Using our firm-level estimates of macro exposure, we create stylised strategies that simply select 30% of the stocks with the highest or lowest exposures to expected inflation, and we weight them according to their market capitalisation. We refer to such strategies as macro-dedicated portfolios.
The alternative to going to stock-level would be to use a set of existing portfolios and allocate across them based on the estimated inflation exposure. Investment practice often uses sector rotations or factor allocations to gain desired macro exposure, as opposed to directly selecting stocks. We provide a comparison with these alternative approaches to illustrate the importance of creating macro-dedicated portfolios. Note that sector and factor allocations will be based on our robust estimation method as well.
The first approach that we compare with allocates equal weights across two out of six equity factor portfolios with the most desirable exposure to expected inflation shocks. The factor portfolios considered are mid-cap, value, high momentum, low volatility, high profitability, and low investment. Single factor portfolios select 30% of the stocks with the highest factor scores and cap-weights them. We refer to such strategies as a factor allocation. The second approach allocates across sectors following the TRBC classification. Three out of ten cap-weighted sectors with the most desired inflation exposures are allocated equal weight in a portfolio. We refer to such strategies as a sector allocation.
Exhibit 4 provides the analysis of realised macro exposures of different equity portfolios. The results suggest that macro-dedicated portfolios constructed from stock-level data achieve out-of-sample realised exposures that are in-line with the target. For example, a portfolio that targets positive inflation exposure has a realised beta of 2.56, while a portfolio that targets negative exposure to inflation has a beta of -1.16.
The results are different for factor or sector allocations. The realised exposures of expected inflation shocks are always positive, even when the factor or sector allocation targets negative inflation exposure. Moreover, the differences between portfolios that target opposite inflation exposures are weak and much smaller than differences between betas of macro-dedicated portfolios.
Exhibit 4: Different Approaches to Targeting Inflation Exposures
United States 31/03/2002 – 30/06/2022 |
Positive Inflation Exposure |
Negative Inflation Exposure |
Difference in Macro Exposures |
| Macro Dedicated Portfolios | 2.56** | -1.16** | 3.70** |
| Factor Allocation | 1.68** | 0.17 | 1.50* |
| Sector Allocation | 3.13** | 2.25** | 0.87 |
The realised macro exposures are estimated in a bivariate regression that includes the market factor and innovations in breakeven inflation. Macro-dedicated portfolios select 30% of the stocks with the most desired inflation exposures. Factor allocation selects 2 out of 6 equity style factor portfolios (cap-weighted 30%). Sector allocation selects 3 out of 10 sector indices (TRBC sectors). Standard errors are adjusted for heteroskedasticity and autocorrelation following Newey-West (1987). We follow Andrews (1991) when determining data-dependent bandwidth/lag truncation parameters, which are estimated in a first-order autoregressive model (AR(1)) with a maximum likelihood method. Statistical significance is indicated by a single asterisk (*) for results that are significant on a 5% basis, and double asterisks (**) for results that are significant on a 1% basis.
Overall, our results clearly indicate that selecting stocks based on their macro exposures leads to more consistent exposures out of sample. This may not be surprising as sectors or factors were not designed to proxy inflation risk, while this is exactly the case for macro-dedicated portfolios. Indeed, reliable measurement of macro exposures is key to allow such portfolios to be created3.
Conclusion
Reliable measurement of macro exposures allows us to create dedicated macro portfolios that come with strong exposure to a given macro variable. The success of our methodology relies on the use of a forward-looking proxy for inflation surprises, robust measurement of stock-level exposures, and construction of dedicated portfolios that exploit information at stock level. Our approach leads to more reliable measurement of inflation exposure than alternative approaches commonly used in the industry. Our macro-dedicated portfolios come with more consistent out-of-sample exposures to inflation surprises than sector or factor allocation strategies.
This methodology can be used to design indices that help investors to position for inflation shocks. Possible applications include designing narrow indices with strong conditionality to inflation, broad indices that extract the equity premium while tilting inflation exposure in the targeted direction or overlay strategies that help protect a multi-factor portfolio against inflation shocks.

- 110-K reports are specific to US companies. However, the methodology can be extended to other countries by looking at respective annual reports that legislation requires to be filed. It is also possible to rely on alternative sources of text data. For example, transcripts of quarterly earnings calls could also be used to identify important risk factors for a given firm.
- 2Our analysis focuses on inflation exposures. However, we have also studied the reliability of other macro exposures over a long-term period. In the following section, we show how our approach performs and how it compares with alternative approaches.
3Esakia and Goltz (2022) report similar benefits of robust estimation and dedicated portfolios when considering other forward-looking macro variables such as the term spread, default spread and short-term interest rates.

- • Amenc, Noël, Mikheil Esakia, Felix Goltz, and Ben Luyten. "Macroeconomic Risks in Equity Factor Investing." Journal of Portfolio Management 45, no. 6 (2019): 39-60.
- • Ang, Andrew, Marie Brière, and Ombretta Signori. "Inflation and Individual Equities." Financial Analysts Journal 68, no. 4 (2012): 36-55.
- • Boons, Martijn. "State Variables, Macroeconomic Activity, and the Cross Section of Individual Stocks." Journal of Financial Economics 119, no. 3 (2016): 489-511.
- • Campbell, John Y. "Understanding Risk and Return." Journal of Political Economy 104, no. 2 (1996): 298-345.
- • Chung, Kee H., and Hao Zhang. "A Simple Approximation of Intraday Spreads Using Daily Data." Journal of Financial Markets 17 (2014): 94-120.
- • Coqueret, Guillaume, Lionel Martellini, and Vincent Milhau. "Equity Portfolios with Improved Liability-Hedging Benefits." Journal of Portfolio Management 43, no. 2 (2017): 37-49.
- • Esakia, Mikheil and Goltz, Felix. "Targeting Macroeconomic Exposures in Equity Portfolios: A Firm-Level Measurement Approach for Out-of-Sample Robustness", working paper (2022)
- • Levi, Yaron, and Ivo Welch. "Best Practice for Cost-Of-Capital Estimates." Journal of Financial and Quantitative Analysis 52, no. 2 (2017): 427-463.
- • Merton, Robert C. "An Intertemporal Capital Asset Pricing Model." Econometrica: Journal of the Econometric Society (1973): 867-887.
- • Petkova, Ralitsa. "Do the Fama–French Factors Proxy for Innovations in Predictive Variables?" Journal of Finance 61, no. 2 (2006): 581-612.
- • Vasicek, Oldrich A. "A Note on Using Cross-Sectional Information in Bayesian Estimation of Security Betas." Journal of Finance 28, no. 5 (1973): 1233-1239.
![]()
Overview: Inflation-Friendly Equity Indices: How to Protect Against Rising Inflation in Equity Portfolios,
Scientific Beta publication, July 2022
Inflation-Friendly Equity Indices: How to Protect against Rising Inflation in Equity Portfolios?,
Journal of Beta Investing Strategies article, Fall 2022
Inflation-Friendly Equity Indices: How to Protect against Rising Inflation in Equity Portfolios?,
Scientific Beta webinar, June 2021
Inflation-Friendly Equity Indices: Robust Tools for Strategic Asset Allocation or Tactical Allocation Choices
In the current unstable macroeconomic environment, investors are actively seeking the right equity tools to protect their portfolio or to take advantage of unexpected inflation shocks. In order to fill a gap in terms of inflation-friendly equity solutions provided to investors, Scientific Beta offers a new approach to overcome macroeconomic measurement challenges and construct dedicated equity portfolios that target desired exposures to surprises in inflation expectations. In this article, we present two families of inflation-friendly equity indices that can be employed either in a long-term strategic allocation or as a short-term tactical tool in a satellite allocation. Furthermore, we illustrate their benefits for investors with two concrete investment cases.
Two dedicated inflation-friendly indices
The inflation-friendly equity indices designed by Scientific Beta employ the methodology developed in Esakia and Goltz (2022) for robust measurement of macroeconomic exposures in equity portfolios. This methodology relies on two pillars that we summarise below.
First, the methodology employs the breakeven inflation rate1 as the relevant inflation variable which is reactive enough, or sufficiently forward-looking, to capture changes in investors' expectations contemporaneously with equity returns. The second key aspect of the methodology is that it uses unexpected changes, also referred to as surprises, innovations, or shocks. By measuring expected inflation in terms of surprises, we can identify stocks that provide protection against inflation changes that are not anticipated by investors.
Then, a robust statistical approach estimates stock-level inflation exposures while controlling for broad market exposure. Complementing the statistical approach, a text-based measure is used that goes beyond returns and looks for additional information to further improve the out-of-sample reliability of exposures to inflation surprises. The final measure of inflation exposure is the average of the cross-sectional rank of the statistical and text-based measures, whereby a higher rank indicates higher exposure to inflation risk (and vice versa)2.
Using this robust measurement of inflation exposure, we can then design dedicated inflation-friendly equity indices with the objective of being used as a core allocation, namely Inflation-Tilted Benchmark indices, or as a satellite allocation, namely Inflation Bet indices3.
Characteristics of inflation-tilted benchmark indices
We design two dedicated inflation-tilted benchmark indices, the Inflation+ and the Inflation- indices, which tilt stock weights in the reference cap-weighted index towards stocks with a positive or negative exposure respectively to expected inflation surprises. The indices target three objectives:
- Provide a substitute to the cap-weighted benchmark while maintaining a high level of investability
- Capture the equity risk premium without targeting long-term outperformance
- Provide the desired conditionality with inflation by offering positive or negative exposure to breakeven inflation surprises, while maintaining reasonable tracking error with the cap-weighted benchmark
These objectives are achieved by ultimately weighting the stocks in the reference cap-weighted index proportionally to the product of an inflation-exposure score and their free-float market-capitalisation weight.
As shown in Exhibit 1 below, inflation-tilted benchmark indices exhibit statistically significant out-of-sample exposures to breakeven inflation surprises. The Inflation+ index has a positive exposure, which means that its relative returns are driven by positive (upwards) inflation shocks, while the Inflation- index has a negative exposure, which means that its relative returns are driven by negative (downwards) inflation shocks.
Exhibit 1: Inflation-Tilted Benchmark Exposure to Breakeven Inflation Surprises
EDHEC-Risk Long-Term Track Record |
US |
Developed |
||
Inflation+ |
Inflation- |
Inflation+ |
Inflation- |
|
| Breakeven Inflation | 0.77 |
-0.77 |
1.13 |
-0.70 |
| T-stat | 5.24 |
-5.85 |
3.63 |
-2.76 |
The analysis is based on weekly USD total returns from 31-Dec-1979 for the EDHEC-Risk US Long-Term Track Record (LTTR) or 31-Dec-1989 for the EDHEC-Risk Developed Long-Term Track Record (LTTR) to 31-Dec-2021. The realised macro exposures are estimated in a bivariate regression that includes the market factor (excess return above the risk-free rate) and weekly inflation innovations, defined as changes in the 10-year breakeven inflation (BEI) rate. The statistics in bold are statistically significant at a 95% level.
A main highlight of the inflation-tilted benchmark indices is that they deliver conditional outperformance over the cap-weighted benchmark during the relevant inflation surprise regimes. In Exhibit 2 below, we define as positive (negative) inflation regimes, the top (bottom) quartiles of weekly inflation innovations defined as changes in the 10-year breakeven inflation rate. Both Inflation+ and Inflation- indices delivered outperformance during their desired exposure-tilted inflation regime, with annualised relative performances of 8.86% and 4.90% in the US (11.94% and 3.05% in Developed) respectively for the Inflation+ and Inflation- indices, a result that confirms the ability of the indices to deliver conditional performances in line with positive and negative inflation surprise regimes in the market.
As a complement, we performed the same conditional analysis but using the US Consumer Price Index for All Urban Consumers (US CPI) regarding the US indices or a GDP-weighted G7 Consumer Price Index (G7 CPI) proxy for the Developed indices respectively, with CPI considered a common measure of inflation used in the industry. We define positive (negative) inflation surprise regimes as the top (bottom) quartiles of monthly realised changes in CPI. We underscore that the conditional behaviour of the inflation-tilted benchmark indices goes in the same direction as when using breakeven inflation rates, even if conditional outperformance and macro spreads are slightly lower. This highlights the robustness of our methodology whatever the definition of the inflation regimes used.
Exhibit 2: Inflation-Tilted Benchmark Indices' Conditional Relative Performance
EDHEC-Risk Long-Term Track Record |
US |
Developed |
||||
# of Regimes |
Inflation+ |
Inflation- |
# of Regimes |
Inflation+ |
Inflation- |
|
| Weekly Breakeven Inflation Innovations | ||||||
| Negative Inflation Surprises | 545 |
-4.75% |
4.90% |
417 |
-3.91% |
3.05% |
| Stable Inflation | 1096 |
-0.33% |
0.21% |
835 |
-0.28% |
-0.05% |
| Positive Inflation Surprises | 551 |
8.86% |
-7.87% |
418 |
11.94% |
-8.48% |
| Macro Spread | - |
13.61% |
-12.77% |
- |
15.86% |
-11.53% |
| Monthly Realised CPI Changes | ||||||
| Negative Inflation Surprises | 126 |
-3.07% |
2.76% |
96 |
-3.63% |
2.61% |
| Stable Inflation | 252 |
0.51% |
-0.46% |
191 |
0.99% |
-0.94% |
| Positive Inflation Surprises | 126 |
3.02% |
-2.57% |
96 |
4.78% |
-3.70% |
| Macro Spread | - |
6.09% |
-5.33% |
- |
8.42% |
-6.31% |
The analysis is based on weekly USD total returns from 31-Dec-1979 for the EDHEC-Risk US Long-Term Track Record (LTTR) or 31-Dec-1989 for the EDHEC-Risk Developed Long-Term Track Record (LTTR) to 31-Dec-2021.Outperformance figures are computed as annualised relative performance of inflation indices compared to the CW index in top (positive surprise) and bottom (negative surprise) quartiles of either weekly inflation innovations, defined as changes in the 10-year breakeven inflation rate, or monthly realised changes in CPI (final estimate of US Consumer Price Index for All Urban Consumers for US indices, GDP-weighted G7 Consumer Price Index proxy for Developed indices). Macro spread is the difference in returns between positive and negative inflation surprise regimes. Macro spreads in bold are statistically significant at a 95% level based on a Welch's t-test.
In line with the rest of their objectives, the inflation-tilted benchmark indices are also able to deliver risk-adjusted performance in line with the cap-weighted index over longer time horizons. As we can see from Exhibit 3, the Sharpe ratio for the US Inflation+ and Inflation- indices is 0.43 and 0.46 respectively, very close to the metric of 0.45 for the broad cap-weighted benchmark. The same holds for the Developed market where the Inflation+ and Inflation- indices exhibit a Sharpe ratio of 0.40 and 0.35 respectively, again close to that of the broad cap-weighted benchmark (0.39). Furthermore, the Inflation indices provide the desired conditionality with respect to expected inflation while maintaining reasonable tracking error with the cap-weighted benchmark (3.4% and 3.1% respectively for the Inflation+ and Inflation- indices in the US or 3.0% and 2.5% respectively in Developed).
Exhibit 3: Inflation-Tilted Benchmark Indices' Risk-Adjusted Performance
EDHEC-Risk Long-Term Track Record |
US |
Developed |
||||
CW |
Inflation+ |
Inflation- |
CW |
Inflation+ |
Inflation- |
|
| Ann. Returns | 12.17% |
12.29% |
12.05% |
8.48% |
9.11% |
7.79% |
| Ann. Volatility | 17.76% |
18.92% |
16.98% |
15.22% |
16.32% |
14.88% |
| Sharpe Ratio | 0.45 |
0.43 |
0.46 |
0.39 |
0.40 |
0.35 |
| Max. Drawdown | 55.5% |
57.3% |
56.0% |
56.95% |
57.48% |
58.08% |
| Ann. Rel. Returns | - |
0.13% |
-0.11% |
- |
0.63% |
-0.69% |
| Ann. Tracking Error | - |
3.41% |
3.07% |
- |
2.97% |
2.53% |
| Information Ratio | - |
0.04 |
n/r |
- |
0.21 |
n/r |
The analysis is based on weekly USD total returns from 31-Dec-1979 for the EDHEC-Risk US Long-Term Track Record (LTTR) or 31-Dec-1989 for the EDHEC-Risk Developed Long-Term Track Record (LTTR) to 31-Dec-2021. All statistics are annualised.
Benefits of inflation-tilted benchmark indices in a core allocation
For an investor with liabilities linked to inflation (proxied by 10-year constant maturity Treasury Inflation-Protected Securities), positive inflation surprises will correspond to an increase in the present value of future liabilities. Hence, replacing the cap-weighted benchmark with the Inflation+ index in a multi-asset portfolio composed of bonds and equities might prove beneficial to improve its funding ratio, namely the relative performance of the multi-asset portfolio to the liabilities. In Exhibit 4, we compare the conditional funding ratio of the multi-asset portfolio including the cap-weighted benchmark or the Inflation+ index in periods of positive inflation surprises. We clearly see the improvement in the conditional funding ratio between the two multi-asset portfolios, as depicted by the excess funding ratio line, which is very stable through time, and represents a conditional excess surplus of 3.9% annualised (see Exhibit 5).
Exhibit 4: Funding Ratio of Multi-Asset Portfolios in Positive Inflation Regimes
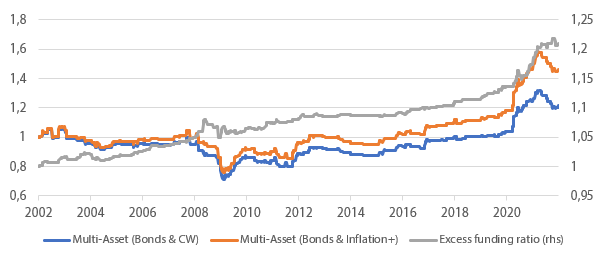
The analysis is based on weekly USD total returns from 31-Dec-2001 to 31-Dec-2021. Liabilities are proxied with 10-year constant maturity Treasury Inflation-Protected Securities and bonds are proxied with 10-year constant maturity treasury securities. The funding ratio is computed as the difference in performance between the multi-asset portfolio and the liabilities only in weeks of positive inflation surprises, where they are defined as top quartiles of breakeven inflation surprises.
Moreover, as seen in Exhibit 5, the average volatility of the surplus is very similar between both portfolios. Hence, the investor will benefit from a stronger surplus per unit of volatility (of the surplus) in these regimes of positive inflation surprises. Finally, we emphasise that extreme levels of the conditional funding ratio or volatility of the funding ratio are reduced when using the Inflation+ index. These conditional improvements are due to the good conditional properties and "cap-weighted like" characteristics of the Inflation+ index.
Exhibit 5: Conditional Funding Ratio Statistics of Multi-Asset Portfolios in Positive Inflation Regimes
EDHEC-Risk US LTTR 31-Dec-2001 to 31-Dec-2021 |
Multi-Asset with CW |
Multi-Asset with Inflation+ |
Difference |
| Ann. Funding Ratio | 3.74% | 7.67% | +105% |
| Extreme 5% Funding Ratio | -0.50% | -1.93% | -19% |
| Volatility of Funding Ratio | 12.3% | 12.6% | +2% |
| Extreme 5% Volatility of Funding Ratio | 18.1% | 17.7% | -2.5% |
| Funding Ratio to Volatility | 0.30 | 0.61 | +101% |
The analysis is based on daily USD total returns from 31-Dec-2001 to 31-Dec-2021. Liabilities are proxied with 10-year constant maturity Treasury Inflation-Protected Securities and bonds are proxied with 10-year constant maturity treasury securities. The funding ratio is computed as the difference in performance between the multi-asset portfolio and the liabilities only in weeks of positive inflation surprises, where they are defined as top quartiles of breakeven inflation surprises. Extreme 5% statistics are computed using a 1-year rolling window with daily steps. Extreme 5% funding ratio corresponds to the lowest 5% rolling funding ratio. Extreme 5% of volatility of funding ratio corresponds to the highest 5% rolling volatility of the funding ratio.
Characteristics of inflation bet indices
With a different objective in mind and to serve the needs of the satellite part of investors' allocations, we design two dedicated inflation bet indices, the Inflation Bet+ and Inflation Bet- indices. In the context of the satellite portfolio, investors are not expecting access to the broad equity premium over the long-term or to obtain the Sharpe ratio offered by the typical cap-weighted benchmark. Instead, the objective is to gain maximal sensitivity with respect to positive or negative inflation surprise regimes and benefit from one's views.
As a result, the objective of the inflation bet indices is to maximise the sensitivity to breakeven inflation surprises. Using these indices, investors should expect strong outperformance in cases where breakeven realisations match prior forecasts. Conversely, portfolio losses should be anticipated if the initial investment was targeting the opposite direction of the realised inflation shocks.
To achieve these objectives, the inflation bet indices are constructed by ranking stocks by inflation score exposure, selecting the top and bottom 50 US stocks (200 for Developed) respectively for the two indices and equally weighting the selected securities to avoid concentration issues.
As shown in Exhibit 6 below, the Inflation Bet+ indices exhibit very strong and statistically significant exposure to positive breakeven inflation surprises. In fact, the exposure for the US is about 4.4 (4.5 in Developed) times higher than the exposure offered by the Inflation+ index. Similarly, the US Inflation Bet- index exhibits an exposure to breakeven inflation that is about 2.2 (2.4 in Developed) times higher than the exposure of the Inflation- index.
Exhibit 6: US Inflation Bet Indices' Exposure to Inflation Surprises
EDHEC-Risk Long-Term Track Record |
US |
Developed |
||
Inflation Bet+ |
Inflation Bet- |
Inflation Bet+ |
Inflation Bet- |
|
| Breakeven Inflation | 3.40 |
-1.73 |
5.11 |
-1.67 |
| T-stat | 5.45 |
-3.62 |
3.39 |
-1.95 |
The analysis is based on weekly USD total returns from 31-Dec-1979 for the EDHEC-Risk US Long-Term Track Record (LTTR) or 31-Dec-1989 for the EDHEC-Risk Developed Long-Term Track Record (LTTR) to 31-Dec-2021. The realised macro exposures are estimated in a bivariate regression that includes the market factor (excess return above the risk-free rate) and weekly inflation innovations, defined as changes in the 10-year breakeven inflation (BEI) rate. The statistics in bold are statistically significant at a 95% level.
In addition, the inflation bet indices offer much stronger conditional outperformance over the cap-weighted benchmark during the relevant inflation surprise regimes compared to the inflation-tilted benchmark indices. In Exhibit 7 below, we observe that the US Inflation Bet+ index displays annualised relative performance of +32.97% (+62.33% for Developed) during positive inflation regimes, which highlights its ability to offer very strong protection to investors in periods of unexpected rising inflation. Similarly, the US Inflation Bet- index is outperforming the benchmark by 16.35% (6.26% for Developed) during periods of negative inflation surprises. These figures are approximately 3.7 and 3.3 times higher for the US market (5.2 and 2.1 times higher for the Developed market) than the equivalent outperformance figures for inflation-tilted benchmark indices. Finally, whether we use weekly breakeven inflation innovations or monthly realised changes in CPI, this has no impact on the conclusion of the analysis as the conditional behaviour of the inflation bet indices goes in the expected direction. This highlights the robustness of our methodology.
Exhibit 7: Inflation-Tilted Benchmark Indices' Conditional Relative Performance
EDHEC-Risk Long-Term Track Record |
US |
Developed |
||||
# of Regimes |
Inflation Bet+ |
Inflation Bet- |
# of Regimes |
Inflation Bet+ |
Inflation Bet- |
|
| Weekly Breakeven Inflation Innovations | ||||||
| Negative Inflation Surprises | 545 |
-19.76% |
16.35% |
261 |
-15.96% |
6.26% |
| Stable Inflation | 1096 |
-1.95% |
-1.27% |
522 |
-0.20% |
-0.75% |
| Positive Inflation Surprises | 551 |
32.97% |
-17.80% |
261 |
62.33% |
-12.84% |
| Macro Spread | - |
52.73% |
-34.15% |
- |
78.29% |
-19.10% |
| Monthly Realised CPI Changes | ||||||
| Negative Inflation Surprises | 123 |
-15.33% |
6.30% |
60 |
-11.83% |
3.25% |
| Stable Inflation | 246 |
0.38% |
-0.74% |
119 |
-0.15% |
1.59% |
| Positive Inflation Surprises | 123 |
11.25% |
-5.13% |
60 |
17.95% |
-6.43% |
| Macro Spread | - |
26.58% |
-11.43% |
- |
29.77% |
-9.69% |
The analysis is based on weekly USD total returns from 31-Dec-1979 for the EDHEC-Risk US Long-Term Track Record (LTTR) or 31-Dec-1989 for the EDHEC-Risk Developed Long-Term Track Record (LTTR) to 31-Dec-2021.Outperformance figures are computed as the annualised relative performance of the inflation indices compared to the CW index in top (positive surprise) and bottom (negative surprise) quartiles of either weekly inflation innovations, defined as changes in the 10-year breakeven inflation rate, or monthly realised changes in CPI (final estimate of US Consumer Price Index for All Urban Consumers for US indices, GDP-weighted G7 Consumer Price Index proxy for Developed indices). Macro spread is the difference in returns between positive and negative inflation surprise regimes. Macro spreads in bold are statistically significant at a 95% level based on a Welch's t-test.
The strong conditionality profile of the inflation bet indices comes with some costs. In effect, as seen in Exhibit 8, they exhibit considerable tracking error, since the Inflation Bet+ index comes with a tracking error of 11.34% while the Inflation Bet- index shows a tracking error of 8.89% that is much larger compared to the inflation-tilted benchmark indices. Moreover, the inflation bet indices do not necessarily capture the long-term equity premium and can exhibit much larger volatility than the cap-weighted benchmark.
Exhibit 8: Inflation-Tilted Benchmark Indices' Risk-Adjusted Performance
EDHEC-Risk Long-Term Track Record |
US |
Developed |
||||
CW |
Inflation Bet+ |
Inflation Bet- |
CW |
Inflation Bet+ |
Inflation Bet- |
|
| Ann. Returns | 12.17% |
10.47% |
12.19% |
8.53% |
8.66% |
8.67% |
| Ann. Volatility | 17.76% |
22.91% |
16.27% |
16.42% |
22.08% |
17.57% |
| Sharpe Ratio | 0.45 |
0.28 |
0.49 |
0.45 |
0.34 |
0.42 |
| Max. Drawdown | 55.5% |
67.1% |
62.9% |
56.95% |
66.22% |
63.98% |
| Ann. Rel. Returns | - |
-1.70% |
0.02% |
- |
0.13% |
0.13% |
| Ann. Tracking Error | - |
11.34% |
8.89% |
- |
9.32% |
6.50% |
| Information Ratio | - |
n/r |
0.00 |
- |
0.01 |
0.02 |
The analysis is based on weekly USD total returns from 31-Dec-1979 for the EDHEC-Risk US Long-Term Track Record (LTTR) or 31-Dec-1989 for the EDHEC-Risk Developed Long-Term Track Record (LTTR) to 31-Dec-2021. All statistics are annualised.
Benefits of inflation bet indices in a core-satellite tactical allocation
We show below how an investor with a long-term strategic allocation to a cap-weighted benchmark can improve its conditional performance in periods of positive inflation surprises by tactically allocating to the Inflation Bet+ index in a core-satellite tactical allocation. Under the case study, the investor, without any view on inflation surprises, is only fully invested in the cap-weighted index, but can make tactical bets to benefit from possible positive inflation surprises by allocating funds to the Inflation Bet+ index. When the investor forecasts a positive inflation surprise for a given week, 10% (or 20% or 30%) of the portfolio is allocated to the satellite Inflation Bet+ index and the remaining 90% (or 80% or 70%) to the core cap-weighted equity index. Otherwise, if no positive inflation surprise is expected, 100% of the portfolio is allocated to the core cap-weighted equity index. We use hit-ratios of 56% (correctly predicting positive inflation surprises 29 out of 52 weeks), 60% (31 out of 52 weeks) and 65% (34 out of 52 weeks).
Looking at Exhibit 9, we observe that the conditional relative performance of the core-satellite portfolios during positive inflation surprise regimes improve as the satellite allocation in the Inflation Bet+ index increases from 10% to 20% and finally to 30% under all different hit-ratio scenarios4. Similarly, higher hit-ratios translate to better conditional returns during positive inflation surprise regimes. At the same time, the unconditional risk-adjusted performances of the overall portfolio are not materially affected, since the long-term Sharpe-ratio of the different portfolios (nine Hit-ratio/Core-Satellite combinations) are in the range of 0.47-0.50 when the long-term Sharpe ratio of the cap-weighted benchmark is at 0.48.
These results show that investors with marginal forecasting ability with respect to breakeven inflation innovations, in the range of 55% to 65% hit-ratios, would be able to achieve strong outperformance potential during positive inflation surprise regimes, relative to a standard core cap-weighted allocation by using the Inflation Bet+ indices. At the same time, their long-term unconditional risk-adjusted performance would not be compromised.
Exhibit 9: Relative Performances w.r.t to Core in Positive Inflation Surprise Regimes
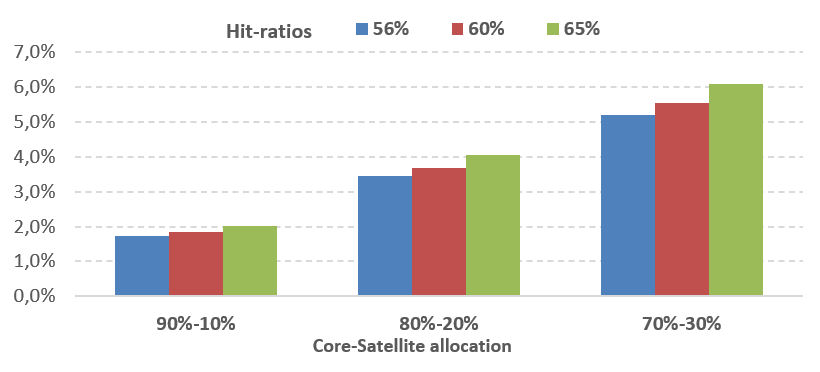
The analysis is based on daily USD total returns from 31-Dec-1979 to 31-Dec-2021. Conditional relative performance figures are computed as cumulative relative performance of the different portfolios in excess of the CW index in top (positive surprise) quartiles of weekly inflation innovations. Innovations are computed as weekly changes in the 10-year breakeven inflation rate. Hit ratios are expressed as a percentage of weeks of correct forecasts of positive inflation surprises over a given year (i.e., 56% is equivalent to 29 weeks out of 52).
A novel approach to protect equity portfolios from inflation
Scientific Beta has designed a novel approach to construct two families of inflation-friendly equity strategies that offer protection from inflation surprises. These portfolios are created with the purpose of serving a core-satellite investment framework, where the core represents investors' strategic long-term allocation, while the satellite represents tactical deviations with respect to this allocation.
On one side, the inflation-tilted benchmark indices are created with the objective of delivering "market-like" characteristics, such as capturing the long-term equity premium, with the additional feature of inflation protection in the form of conditional outperformance over the cap-weighted benchmark during positive or negative inflation surprise regimes. Hence, they are designed to be ideal candidates for cap-weighted index replacement in a long-term strategic allocation to provide protection against inflation surprises.
On the other hand, the main objective of the inflation bet indices is to offer strong sensitivity to positive or negative inflation surprise regimes for investors who wish to take tactical bets on inflation. We have showed that even with weak forecasting skills, investors can use inflation bet indices in a tactical core-satellite allocation and improve the conditional performance of the resulting portfolio in periods of positive inflation surprise while conserving long-term risk-adjusted performance in line with the cap-weighted benchmark.
-
- 1Breakeven inflation is derived from observable prices of the relevant government bond markets such that they reflect investors' expectations about inflation over the next 10 years. In the case of US indices, it is calculated as the difference between the yield of 10-year US Treasury Inflation-Protected Securities (TIPS) and 10-Year US Treasury Securities. In the case of Developed indices, a G7 breakeven inflation proxy rate is computed by GDP-weighting the individual G7 country breakeven rates using 10-year maturities.
- 2The text-based metric relies on the risk factors section of US firms' annual 10-K filings. As a result, it forms part of the estimation methodology only for the US indices and not for the Developed region where similar information is not available.
3Results presented in this article are based on a Long-Term Track Record (LTTR) dataset spanning more than 40 years of data for the US market or over 30 years for the Developed region. Regarding the availability of long-term data for breakeven inflation during periods that Treasury Inflation-Protected Securities did not exist, we follow the design of a long-term proxy for expected inflation surprises as described in Esakia and Goltz (2022).
4We follow the methodology in Amenc, Goltz and Grigoriu (2010) and assume a positive inflation forecasting ability, namely correctly forecasting positive inflation surprises, by the investor for a certain number of weeks per year. To evaluate the performance of this approach, for each portfolio allocation, we simulate 10,000 scenarios for the period from January 1979 to December 2021 using the EDHEC-Risk US long-term track record dataset.
-
- • Amenc, Goltz, Grigoriu (2010). Risk Control through Dynamic Core-Satellite Portfolios of ETFs: Applications to Absolute Return Funds and Tactical Asset Allocation, EDHEC-Risk Institute Publication.
- • Esakia, M and F. Goltz (2022). Targeting Macroeconomic Exposures in Equity Portfolios: A Firm-Level Measurement Approach for Out-of-Sample Robustness. Scientific Beta Publication (February 2022).
![]()
Overview: Inflation-Friendly Equity Indices: How to Protect Against Rising Inflation in Equity Portfolios,
Scientific Beta publication, July 2022
Inflation-Friendly Equity Indices: How to Protect against Rising Inflation in Equity Portfolios?,
Journal of Beta Investing Strategies article, Fall 2022
Inflation-Friendly Equity Indices: How to Protect against Rising Inflation in Equity Portfolios?,
Scientific Beta webinar, June 2021
A Review of Inflation-Friendly Equity Strategies
Following the recovery from the Covid-19 crisis, inflation has emerged as a significant portfolio risk facing investors. Scientific Beta has designed two families of inflation-friendly equity indices that are able to protect investors' portfolios against rising inflation. The first family, termed Inflation-tilted benchmark indices, is comprised of the Inflation+ and Inflation- indices which are ideal candidates to replace an equity cap-weighted benchmark in a core allocation for investors who wish to protect their portfolio against inflation surprises. The second family, termed Inflation Bet indices, covers the Inflation Bet+ and Inflation Bet- indices which are well suited for the satellite part of investors' portfolios. In this article, we look at the small set of competitor inflation sensitive strategies currently available in the marketplace. We review their main methodological choices and compare their quantitative profile relative to the Scientific Beta Inflation indices.
Introduction
Following the recovery from the Covid-19 crisis, inflation has emerged as a significant portfolio risk facing investors. Using TIPS to fully hedge inflation risk has a high opportunity cost. Instead, investors can turn to their equity portfolio to provide some protection against inflation surprises. Equities are a natural candidate to provide some protection and unlike commodities, equities also offer a positive long-term risk premium.
Scientific Beta has designed two families of inflation-friendly equity indices that are able to protect investors' portfolios against rising inflation. Their design is based on the methodology developed in Esakia and Goltz (2022).
The first family, termed Inflation-tilted benchmark indices, is comprised of the Inflation+ and Inflation- indices, which are ideal candidates to replace a cap-weighted equity benchmark in a core allocation for investors who wish to protect their portfolio against inflation surprises. They are designed to deliver the equity market risk premium over the long-term while offering the desired conditionality with inflation by offering positive or negative exposure to breakeven inflation surprises, respectively, via reasonable tracking error with the cap-weighted benchmark. This type of index is therefore a good substitute for a cap-weighted index as a benchmark that is representative of the equity asset class for a long-term investor who has liabilities that are exposed to inflation risk. This asset-liability management (ALM) approach differs from an asset management (AM) approach that has the sole objective of maximising the Sharpe ratio of the equity investment in an unconditional way.
The second family, termed Inflation Bet indices, covers the Inflation Bet+ and Inflation Bet- indices, which are well suited for the satellite part of investors' portfolios. These indices enable investors to take tactical bets and generate potential short-term outperformance in regimes of positive or negative breakeven inflation surprises. Their design aims to maximise the exposure to positive or negative breakeven inflation surprises. Using these indices as a satellite allocation, investors can implement their views on future realisation of inflation and generate outperformance relative to the core cap-weighted benchmark allocation. This involves a conditional approach to performance in a classic asset management context in which the CIO wishes to transform their views, on inflation in this instance, into additional performance.
Other providers of indices and active portfolio strategies have also designed equity strategies targeting inflation. In this article, we look at the small set of competitor inflation sensitive strategies currently available in the marketplace. We review their main methodological choices and compare their quantitative profile relative to the Scientific Beta Inflation indices.
Design of competitor inflation strategies
In addition to the Scientific Beta Inflation indices, there is only a handful of equity inflation-friendly strategies currently offered by competitors and these are listed in Exhibit 1. Furthermore, Exhibit 2 provides an overview of the index construction methods for this selection of inflation-friendly equity products.
Exhibit 1: List of Inflation-Friendly Equity Strategies
Index/Strategy Name |
Index/Strategy Provider |
| Scientific Beta Inflation+/- Index | Scientific Beta |
| Scientific Beta Inflation Bet+/- Index |
Scientific Beta |
| MSCI USA Inflation Sentiment Select 100 Index | MSCI |
| MSCI USA Inflation Sensitivity Select 50 Index | MSCI |
| Fidelity Stocks for Inflation Factor Index | Fidelity |
Looking at the methodology of the competitor strategies, it is important to note that they all target inflation in a single direction, that of protecting against positive inflation shocks. Scientific Beta, in its capacity as an index provider, aims to provide investors with solutions covering all relevant investment scenarios and as a result, it offers inflation-friendly equity indices that target inflation sensitivity in either positive or negative inflation shocks to suit all investment needs. Furthermore, and unlike competitor products which cover only a specific region, Scientific Beta is offering its suite of inflation-friendly indices for both US and Developed world universes, thus extending the available solutions to investors to cover protection for both US and global inflation.
Another important point to highlight is that Scientific Beta has designed its suite of inflation-friendly equity strategies in a way that separately satisfies the needs of the core and the satellite parts of investors' allocations. This avoids the one-size-fits all approach of competitor strategies.
Exhibit 2: Methodology Overview of Equity Inflation-Friendly Portfolios
Category |
Methodology |
Inflation Score |
Universe |
Stock Weighting Scheme |
| Scientific Beta Inflation+/- Index | Stocks ranked by Inflation score and weights are tilted relative to their market capitalisation | A regression analysis identifies the sensitivity of stocks to changes in breakeven inflation, while controlling for market exposure of individual stocks and accounting for both time variation and uncertainty in exposure. Breakeven inflation is measured as the difference between the yield of 10-year US Treasury Inflation-Protected Securities (TIPS) and 10-Year US Treasury Securities in the case of US indices, or GDP-weighting individual G7 country 10-year breakeven inflation rates in the case of Developed indices. Regarding the US indices, the statistical approach is also complemented (equally weighted) by a textual analysis which looks at the risk factors section of US firms' annual 10-K filings to measure exposure as the frequency of mentions related to inflation. |
US or Developed (large and mid-cap) | Inflation score tilting around market capitalisation weights |
| Scientific Beta Inflation Bet+/- Index |
Stocks ranked by Inflation score and top 50 (US) or top 200 (Developed) are selected |
Equal weighting subject to liquidity rules |
||
| MSCI USA Inflation Sentiment Select 100 Index | Stocks ranked by Inflation score and top 100 are selected | A regression analysis assesses the sensitivity of stocks to inflation separately on five variables employed to capture inflation innovations which are then combined for a final score: a) changes in 5-year breakeven inflation, b) gold price changes, c) oil price changes, d) indicator on Fed's concern with inflation relative to unemployment and e) indicators whether an increase or decrease in inflation is expected. Regressions include an interaction term with inflation attention (defined based on proprietary textual analysis). | US (large and mid-cap) | Equal weighting |
| MSCI USA Inflation Sensitivity Select 50 Index | Stocks ranked by Inflation score and top 50 are selected | |||
| Fidelity Stocks for Inflation Factor Index | Factor targeting strategy (Size, Value, Momentum, Quality) with additional tilting of sectors based on inflation sensitivity | Sectors under the Energy, Materials, Consumer Staples, Health Care, Real Estate, Utilities sectors and some Industrials and Communication Services sub-sectors receive an overweight relative to the benchmark, whereas sectors such as Information Technology, Financials, Consumer Discretionary and remaining companies under Industrials and Communication Services receive an underweight. | Top 1000 US companies by market cap | Factors score weighting |
Going into more detail regarding the design choices, we see a disparity in methodological approaches. MSCI offers two strategies which are variations of the same methodology with just a different portfolio size with respect to the inflation-based stock selection. Nevertheless, the number of stocks selected remains very similar between the two strategies as both target a narrow selection relative to the available universe. This questions the need for both being offered to investors at the same time. In terms of the inflation score model selected, we can see that sensitivity to breakeven inflation is only one out of five variables used, which potentially diminishes its relevance to the final model. In fact, what investors are looking for with regards to inflation protection is sensitivity to inflation expectations, which are well expressed in the market via the breakeven inflation measure. In addition, the choice of oil as a relevant variable could be justified as representing a reasonable proxy for energy prices (one of three main components for Consumer Price Index, a common metric of inflation in the market) but equally the choice of gold cannot be similarly justified.
Next, the Fidelity index is primarily a multi-factor strategy with inflation sensitivity only added to the portfolio construction via a sector-tilting approach. In fact, it has been common practice for investment managers to rely mainly on off-the-shelf building blocks, such as sectors or style factors, to manage exposure to macroeconomic risk. However, such building blocks have never been designed to efficiently target macro risks. Instead, our approach utilises stock-level information to build dedicated portfolios that emphasise the most relevant stocks with respect to inflation sensitivity. Esakia and Goltz (2022) discuss this point in more detail and show numerically that dedicated macro strategies come with stronger and more consistent realised exposures than allocation approaches that use sectors or factors as building blocks.
In what follows, we compare the performances of the inflation-friendly strategies that target positive unexpected inflation shocks, i.e., the Scientific Beta Inflation+ and Inflation Bet+ indices, and the set of competitor strategies. We acknowledge that this selection of inflation-friendly equity strategies follows different stock selection schemes, inflation sensitivity metrics, and weighting schemes; however, they share the same explicit objective of targeting positive exposure to unexpected inflation shocks.
Inflation is difficult to assess unequivocally and there is no unique measure of it; on the contrary there are various metrics to account for inflation (inflation surveys, breakeven inflation rates, CPI headline, CPI core, etc.), which may or may not reflect the practices of those investing in assets and the strategies designed to provide inflation protection. Despite inflation being complex to measure, we need to specify an ex-ante inflationary regime rule to evaluate the conditional performance of these inflation-friendly portfolios. Ultimately, what matters for equity prices is what market participants deem to be the most appropriate measure; hence, we settle on two alternative measures of inflation surprises that will be used to assess the conditional performance of alternative inflation-friendly portfolios: weekly breakeven inflation1 (or BEI) rate innovations and monthly realised CPI changes2. The results presented here are generally robust under the two different definitions of inflation expectations selected.
Comparative analysis of Scientific Beta and competitor inflation strategies regarding investors' core allocation
In this section, we compare the performance of the inflation-friendly strategies that target positive unexpected inflation shocks in a core asset allocation setting, i.e., the Scientific Beta Inflation+ index, and the Fidelity Stocks for Inflation index.
Under the core allocation, investors' equity portfolios may already come with substantial exposures not only to stock market risk, but also to broader macroeconomic risks, such as inflation risk. Such implicit exposures will not necessarily align with what an investor would target when considering macroeconomic risk exposures explicitly. If an investor is already exposed to a given macroeconomic risk outside their equity allocation, the total portfolio will not be well diversified and will suffer losses if a given macroeconomic risk materialises. For example, the inflation-linked liabilities of a pension fund will increase with rising inflation. Holding stocks with negative exposure to inflation will lead to poor diversification and greater capital at risk during times of positive inflation shocks. Therefore, any inflation-friendly index designed to form part of an investor's core allocation should be able to deliver the desired conditionality with inflation by offering positive or negative exposure to breakeven inflation surprises, respectively, via reasonable tracking error with the cap-weighted benchmark.
Exhibit 3: Indices' Exposure to Inflation Surprises
US LTTR (RI/USD) 31-Dec-1995 to 31-Dec-2021 |
EDHEC-Risk US LTTR Inflation+ |
Fidelity Stocks for Inflation Index |
| Inflation Shocks Measured as Weekly Breakeven Inflation Innovations | ||
| Weekly Breakeven Inflation | 0.65 |
1.17 |
| T-stat | (2.10) |
(2.34) |
| Inflation Shocks Measured as Monthly Realised CPI Changes | ||
| Monthly Realised CPI Changes | 0.99 |
1.75 |
| T-stat | (3.39) |
(6.28) |
The analysis is based on weekly USD total returns from 31-Dec-1995 to 31-Dec-2021. The realised inflation exposures measured as breakeven inflation are estimated in a bivariate regression that includes the market factor (excess return above the risk-free rate) and weekly inflation innovations, defined as changes in the 10-year breakeven inflation rate. The realised inflation exposures measured as realised CPI changes are estimated in a bivariate regression that includes the market factor (excess return above the risk-free rate) and monthly inflation innovations, defined as Monthly Realised CPI changes. Statistics in bold are statistically significant at a 95% level. The indices used are the EDHEC-Risk US LTTR Inflation+, the EDHEC-Risk US LTTR Cap-Weighted and the Fidelity Stocks for Inflation Index.
In order to start analysing these strategies, Exhibit 3 above compares the unconditional exposure to inflation surprises for these two inflation-friendly strategies over their available sample, which spans a period of 25 years, from December 1995 to December 2021. As reported, both indices considered exhibit statistically significant out-of-sample exposures to inflation shocks measured as weekly breakeven inflation surprises or monthly realised CPI changes. The indices analysed have a positive unconditional exposure, which means that their relative returns are driven by positive (upwards) inflation shocks.
However, we can start to see some differences when we look more closely at a conditional relative performance analysis of the strategies under consideration, as shown in Exhibit 4, and at their deviations relative to the cap-weighted benchmark, as depicted in Exhibit 5.
Exhibit 4: Conditional Outperformance during Weekly Breakeven Inflation Surprise Regimes
US LTTR (RI/USD) 31-Dec-1995 to 31-Dec-2021 |
# Regimes (Weeks) |
EDHEC-Risk US
LTTR Inflation+ |
Fidelity Stocks
for Inflation Index |
| Relative Performance to Cap-Weighted Index in Different Regimes (Weekly Breakeven Inflation Innovations) | |||
| Negative Inflation Surprises | 316 |
-3.45% |
1.53% |
| Stable Inflation | 709 |
0.16% |
1.66% |
| Positive Inflation Surprises | 332 |
11.28% |
-0.39% |
| Macro Spread | - |
14.73% |
-1.92% |
| Macro Spread/TE | - |
3.92 |
- |
| Macro Spread/1Y Roll Rel. Ret. Worst 5% | - |
3.04 |
- |
| Macro Spread/3Y Roll Rel. Ret. Worst 5% | - |
9.00 |
- |
| Relative Performance to Cap-Weighted Index in Different Regimes (Monthly Realised CPI Changes) | |||
| Negative Inflation Surprises | 106 |
-2.70% |
-1.64% |
| Stable Inflation | 145 |
1.76% |
0.74% |
| Positive Inflation Surprises | 61 |
6.16% |
9.24% |
| Macro Spread | - |
8.86% |
10.88% |
| Macro Spread/TE | - |
2.36 |
1.99 |
| Macro Spread/1Y Roll Rel. Ret. Worst 5% | - |
1.83 |
0.85 |
| Macro Spread/3Y Roll Rel. Ret. Worst 5% | - |
5.42 |
1.20 |
The analysis is based on daily USD total returns from 31-Dec-1995 to 31-Dec-2021. Outperformance figures are computed as annualised relative performance of the inflation indices compared to the CW index in top (positive surprise) and bottom (negative surprise) quartiles of weekly inflation innovations defined as changes of the 10-Year Breakeven Inflation Rate or monthly realised CPI changes; regimes are defined over the period 31-Dec-1979 to 31-Dec-2021. Macro spread is the difference in returns between positive and negative inflation surprise regimes. The indices used are the EDHEC-Risk US LTTR Inflation+, the EDHEC-Risk US LTTR Cap-Weighted and the Fidelity Stocks for Inflation Index.
The Scientific Beta Inflation+ benchmark-tilted index achieves strong outperformance relative to the cap-weighted benchmark in positive inflation surprise regimes, whether BEI or CPI-defined. This is achieved while the index maintains relatively low tracking error versus the cap-weighted benchmark, measured at 3.76%, as we can see from Exhibit 5.
Exhibit 5: Inflation-Friendly Indices' Deviations relative to the Cap-Weighted Benchmark
US LTTR (RI/USD)
31-Dec-1995 to 31-Dec-2021 |
EDHEC-Risk US LTTR Inflation+ |
Fidelity Stocks for Inflation Index |
| Ann. Tracking Error | 3.76% |
5.47% |
| 1Y Rolling Relative Returns Worst 5% | -4.85% |
-12.77% |
| 3Y Rolling Relative Returns Worst 5% | -1.64% |
-9.08% |
The analysis is based on daily USD total returns from 31-Dec-1995 to 31-Dec-2021. The indices used are the EDHEC-Risk US LTTR Inflation+, the EDHEC-Risk US LTTR Cap-Weighted and the Fidelity Stocks for Inflation Index.
Overall, as we can see from Exhibit 4, the Inflation+ index delivers a strong macro spread per unit of tracking error when measured against regimes defined based on breakeven inflation innovations, which demonstrates that it offers good conditionality to inflation surprises while maintaining "cap-weight like" characteristics. When inflation regimes are measured according to CPI, the macro spread per unit of tracking error for the Scientific Beta Inflation+ index is 2.36, which is about 20% higher than the Fidelity Stocks for Inflation index. Similarly, measuring the macro spread per unit of worst relative returns shows that the Scientific Beta Inflation+ index again has the better ratio between the two indices.
In summary, the Scientific Beta Inflation+ index shows a stronger profile regarding sensitivity to inflation (measured by the macro spread) relative to both average (measured by the tracking error) and extreme (measured by 1Y and 3Y worst relative returns) measures of deviations relative to the cap-weighted benchmark. As a result, this makes the Inflation+ index a strong candidate for investors' core allocation to replace a traditional cap-weighted benchmark with an asset that retains "cap-weight like" characteristics while delivering strong conditionality with inflation by offering positive exposure to breakeven inflation surprises.
Comparable analysis of Scientific Beta and competitor inflation strategies regarding investors' satellite allocation
In this section, we compare the inflation-friendly strategies that target positive unexpected inflation shocks in a satellite asset allocation setting, i.e., the Scientific Beta Inflation Bet+ index, the MSCI Inflation Sentiment Select 100 index and the MSCI Inflation Sensitivity Select 50 index.
Regarding the satellite part of the allocation, investors aim to explore their views on future economic conditions and gain additional performance if their predictions materialise. For instance, a portfolio manager expecting upward changes to inflation will be able to add returns if their satellite allocation includes a portfolio with strong positive inflation exposure ahead of such conditions being realised in the market.
Exhibit 6 below allows us first to compare the unconditional exposure to inflation surprises for the satellite inflation-friendly strategies offered by Scientific Beta and MSCI over the overlapping sample available across these indices, i.e., a period of nearly 10 years, from December 2012 to June 2022.
As shown in Exhibit 6, all three inflation-friendly indices considered exhibit statistically significant out-of-sample exposures to inflation shocks measured as weekly breakeven inflation surprises or monthly realised CPI changes. The indices analysed have positive unconditional exposure, which means that their relative returns are driven by positive (upwards) inflation shocks; among the indices compared, the Scientific Beta Inflation Bet+ index exhibits the strongest out-of-sample exposure to inflation surprises, with a beta to weekly breakeven inflation innovations of about 12.12, which is roughly 33% higher than the beta measured for the MSCI Inflation Select 50 Index, which is the next most inflation-sensitive strategy in the competitors pool. These results, and the relative magnitudes, are consistent also when comparing the betas to inflation shocks measured as monthly realised CPI changes.
Exhibit 6: Indices' Exposure to Inflation Surprises
USA (RI/USD) 31-Dec-2012 to 30-Jun-2022 |
SciBeta Inflation Bet+ |
MSCI Inflation
Select 100 Index |
MSCI Inflation
Select 50 Index |
| Inflation Shocks Measured as Weekly Breakeven Inflation Innovations | |||
| Weekly Breakeven Inflation | 12.12 |
8.14 |
9.11 |
| T-stat | (5.01) |
(5.91) |
(6.25) |
| Inflation Shocks Measured as Monthly Realised CPI Changes | |||
| Monthly Realised CPI Changes | 5.76 |
3.27 |
4.42 |
| T-stat | (5.17) |
(4.65) |
(5.28) |
The analysis is based on weekly USD total returns from 31-Dec-2012 to 30-June-2022. The realised inflation exposures measured as breakeven inflation are estimated in a bivariate regression that includes the market factor (excess return above the risk-free rate) and weekly inflation innovations, defined as changes in the 10-year breakeven inflation rate. The realised inflation exposures measured as realised CPI changes are estimated in a bivariate regression that includes the market factor (excess return above the risk-free rate) and monthly inflation innovations, defined as Monthly Realised CPI changes. Statistics in bold are statistically significant at a 95% level. The idices used are the SciBeta US Inflation Bet+, the SciBeta US Cap-Weighted, the MSCI USA Inflation Sentiment Select 100 Index and the MSCI USA Inflation Sensitive Select 50 Index.
Next, Exhibit 7 depicts a conditional relative performance analysis of the strategies under consideration. We see that the Scientific Beta Inflation Bet+ index offers much stronger conditional outperformance over the cap-weighted benchmark during the relevant inflation surprise regimes compared to the competitors' strategies. It displays an annualised relative performance of +80.62% during positive inflation regimes, defined using weekly breakeven inflation innovations, which highlights its ability to offer very strong protection to investors in periods of unexpected rising inflation.
Exhibit 7: Conditional Outperformance during Weekly Breakeven Inflation Surprise Regimes
USA (RI/USD) 31-Dec-2012 to 30-Jun-2022 |
# Regimes (Weeks) |
SciBeta Inflation Bet+ |
MSCI Inflation Select 100 Index |
MSCI Inflation Select 50 Index |
| Relative Performance to Cap-Weighted Index in Different Regimes (Weekly Breakeven Inflation Innovations) | ||||
| Negative Inflation Surprises | 100 |
-26.16% |
-16.80% |
-19.12% |
| Stable Inflation | 296 |
-2.77% |
-6.94% |
-6.83% |
| Positive Inflation Surprises | 99 |
80.62% |
54.85% |
69.32% |
| Macro Spread | - |
106.78% |
71.65% |
88.43% |
| Relative Performance to Cap-Weighted Index in Different Regimes (Monthly Realised CPI Changes) | ||||
| Negative Inflation Surprises | 42 |
-21.67% |
-11.23% |
-14.28% |
| Stable Inflation | 50 |
9.76% |
-1.27% |
2.08% |
| Positive Inflation Surprises | 22 |
19.54% |
10.87% |
15.77% |
| Macro Spread | - |
41.21% |
22.10% |
30.05% |
The analysis is based on daily USD total returns from 31-Dec-2012 to 30-June-2022. Outperformance figures are computed as the annualised relative performance of the inflation indices compared to the CW index in top (positive surprise) and bottom (negative surprise) quartiles of weekly inflation innovations defined as changes of the 10-Year Breakeven Inflation Rate or monthly realised CPI changes; regimes are defined over the period 31-Dec-1979 to 30-Jun-2022. Macro spread is the difference in returns between positive and negative inflation surprise regimes. The indices used are the SciBeta US Inflation Bet+, the SciBeta US Cap-Weighted, the MSCI USA Inflation Sentiment Select 100 Index and the MSCI USA Inflation Sensitive Select 50 Index.
In fact, the Inflation Bet+ index shows conditional outperformance over the cap-weighted benchmark during positive inflation surprise regimes that is about 1.5 and 1.2 times stronger than the MSCI Inflation Select 100 and the MSCI Inflation Select 50 indices respectively. The difference is robust when you compare their performance during CPI-based positive inflation regimes with 1.8 and 1.2 times stronger relative outperformance to the cap-weighted benchmark than that provided by the two MSCI indices respectively.
This analysis highlights that the Inflation Bet+ index can be a very useful tool for tactical asset allocation decisions when the investor's goal is to gain maximal sensitivity with respect to inflation surprise regimes and benefit from one's views. The Inflation Bet+ index is indeed an index whose objective is to maximise the sensitivity with respect to breakeven inflation surprises. Using this index, investors should expect to outperform a passive cap-weighted benchmark allocation in cases where breakeven inflation realisations match prior forecasts. As we can see from Exhibit 7, its higher sensitivity and better relative outperformance to the cap-weighted benchmark, compared to competitor strategies, means that an investor could potentially require less correct forecasts when it comes to positive inflation surprises to realise the same outperformance potential.
Conclusion
In this article, we have compared the available set of competitor and Scientific Beta inflation-friendly equity indices both from an index design point of view and through the lens of a comparative performance analysis.
Scientific Beta is offering investors two families of inflation-friendly equity strategies that offer protection against inflation regarding both positive and negative inflation surprises. These strategies serve the needs of a core-satellite investment framework, where the core represents investors' strategic long-term allocation, while the satellite represents tactical deviations with respect to this allocation. Instead, competitor inflation strategies seem to have been created with the approach of one-size-fits-all. In addition, their sensitivity is only targeting protection against positive inflation surprises, leaving investors without the necessary tools to cover all different investment scenarios. Finally, a conditional performance analysis highlights the superiority of the Scientific Beta strategies in serving the objectives of inflation protection in both a core and satellite investment framework.
-
- 1Breakeven inflation rates are derived from observable market prices as the difference between the yield of 10-year US Treasury Inflation-Protected Securities (TIPS) and 10-Year US Treasury Securities. This difference reflects investors' expectations about inflation over the next 10 years.
- 2The CPI used here refers to the final estimate of the US Consumer Price Index for All Urban Consumers.
-
- • Esakia, M and F. Goltz (2022). Targeting Macroeconomic Exposures in Equity Portfolios: A Firm-Level Measurement Approach for Out-of-Sample Robustness. Scientific Beta Publication (February 2022).
![]()
Overview: Inflation-Friendly Equity Indices: How to Protect Against Rising Inflation in Equity Portfolios,
Scientific Beta publication, July 2022
Inflation-Friendly Equity Indices: How to Protect against Rising Inflation in Equity Portfolios?,
Journal of Beta Investing Strategies article, Fall 2022
Inflation-Friendly Equity Indices: How to Protect against Rising Inflation in Equity Portfolios?,
Scientific Beta webinar, June 2021