

Unsustainable Proposals
By failing to represent investors' interests and through its deficiencies, the proposal for the new European regulation on sustainable benchmarks is not the right answer to climate transition. In a comprehensive analysis of the recent proposals from the Technical Expert Group (TEG), which the European Commission mandated to assist it in drawing up delegated acts implementing the Regulation on Climate Benchmarks and Sustainability Disclosures of Benchmarks (2019/2089), Scientific Beta underlines that these proposals go against the legislator's goal of an ambitious reorientation of investment flows in support of climate transition and sustainability.
The November 2019 update of the European Benchmark Regulation creates official labels for Climate Benchmarks and requires that benchmark statement and methodology include explanations of how Environmental, Social and Governance (hereafter "ESG") dimensions are reflected when a Benchmark pursues ESG objectives. The EU Climate Transition and Paris-aligned Benchmarks labels aim to harmonise and improve transparency of the climate change index market at the EU level and to combat misleading claims as to the environmental credentials of investments, or "greenwashing". The introduction of disclosure requirements with respect to ESG incorporation into Benchmarks is intended to facilitate cross-border comparisons and help market participants make well-informed choices.
In this context, the legislator has empowered the European Commission (hereafter "the Commission") to adopt delegated acts to specify minimum standards of index construction for EU Climate Benchmarks and to lay out the minimum contents of explanations about ESG incorporation and their standard format for Benchmarks pursuing ESG objectives.
The Commission released its proposals on 8 April and is inviting feedback until 6 May. We find these proposals wanting in several material aspects.
As summarised by the Technical Expert Group ("TEG") that advised the Commission, the updated Benchmark Regulation aims to: (i) allow a significant level of comparability of Climate Benchmarks methodologies while leaving administrators with an important level of flexibility in designing their methodologies; (ii) provide investors with an appropriate tool that is aligned with their investment strategy; (iii) increase transparency on investors' impact, specifically with regard to climate change and the energy transition; and (iv) de-incentivise greenwashing (TEG Final Report on Climate Benchmarks and Benchmarks' ESG Disclosures, September 2019).
In respect of the objectives of flexibility and alignment with investor needs (objectives (i) and (ii)), we conclude that the overly prescriptive nature of the delegated act pertaining to Climate Benchmark requirements and its anchoring on broad-universe capitalisation weights considerably reduces the flexibility of administrators to provide investors with Climate Benchmarks aligned with the diversity of their investment strategies. While there is no doubt that Climate Benchmark versions of broad-universe capitalisation-weighted indices would be important tools for investors, index-based investment strategies have traditionally included sector indices and have diversified considerably over the last 15 years. For Climate Benchmarks to have the widest relevance allowed by the Regulation, the diversity of index-strategies should be respected in the delegated acts. In this regard, we feel strongly that climate-conscious investors should not be corralled into one particular class of indices or excessively restricted by implicit methodological options. Ensuring flexibility and alignment with investor needs would also contribute to combatting greenwashing (objective (iv)) by enhancing the scope of effective control exercised over the quality of the claims made by administrators in respect of the climate characteristics of their products.
To avoid narrowing the scope of the Regulation, we thus recommend that Climate Benchmarks retain full flexibility in respect of sector exposures while being required to achieve a high level of decarbonisation in a manner that controls for any sector effects. Specifically, we recommend that the targeted level of decarbonisation be achieved through intra-sector security selection and weighting choices. Doing so prevents the gaming of decarbonisation by cross-sector reallocation, which the TEG proposal encourages and which in our view constitutes greenwashing (incompatible with objective (iv)). We also recommend that the respect of the decarbonisation target of an index strategy be assessed in relation to its non-decarbonised version rather than the market benchmark. Concerns about the risks of confusion and misleading claims about the extent of decarbonisation could be assuaged by appropriate disclosures, e.g. by requiring that decarbonisation be reported relative to the market benchmark.
With respect to the objective of enhanced transparency on Climate Change impact (objective (iii)), we note that the carbon metric put forward in the proposal is an exposure metric rather than a measure of indirect contribution to Climate Change through financed emissions, i.e. a carbon footprint in a strict sense. We recognise however that the self-decarbonisation constraint included in the proposal, whereby the Benchmark metric must fall by 7% year after year, promotes continued reduction in financed emissions and we admit that there are considerable benefits to using carbon metrics that have achieved wide acceptance such as the standard version of WACI.
However, we have grave reservations about the novel "carbon intensity" measure introduced by the proposal. At the very least, this innovation appears counterproductive with regard to the investments already made by concerned parties in the education of the investment management industry and the wider public and in the design of relevant investment products and solutions. We strongly feel that the introduction of novel metrics should be supported by both academic and cost-benefit analyses documenting their superiority over those metrics that have achieved a wide consensus. We also find that even casual observation of the proposed metric is sufficient to reveal multiple flaws.
Particularly problematic is the fact that the volatility the metric imports from equity market values makes it incompatible with the self-decarbonisation requirement, which controls for price inflation but fails to consider the possibility and consequences of market downturns. This is richly illustrated by the recent spike in "carbon intensity" of products that were launched precipitously to comply with the standards being developed. We understand that the proposed metric implicitly targets the coal industry whose capitalisation may be depressed by the prospect of stranded assets. However, the consequences of this tweaking have not been thought through and the regulator would be well advised to backtrack on this half-baked proposal. Where the regulator feels a sector should be subjected to divestment, it should simply require it explicitly to avoid unintended and detrimental consequences from indirect targeting (why should other sectors with depressed capitalisations be made to suffer and those with rich multiples be advantaged?). Since coal divestment is already an uncontroversial dimension of decarbonisation for most investors, one may object that the unneeded subsidy to coal divestment hidden in the metric allows less ambitious decarbonisation programmes to meet the requirements for qualification as Climate Benchmarks.
Another key issue with the metric upon which the proposal relies for assessing decarbonisation is its direct consideration of value-chain indirect ("Scope 3") emissions, which by the very admission of the TEG will not be fit for the purpose of stock selection "for the foreseeable future." As these emissions are larger than the sum of direct ("Scope 1") and energy-related indirect ("Scope 2") emissions by an order of magnitude in most sectors, their combination will drown out any corporate-level signal present in Scope 1-2 emissions in a sea of noisy product and activity-based Scope 3-estimated emissions. Unless one wishes to cynically disregard efforts made by companies in the mitigation of their greenhouse gas emissions, we recommend the consideration of Scope 3 emissions be done indirectly via related metrics that can support security-level analysis.
For the above reasons, we strongly recommend that the standard version of WACI (i.e. that with Scope 1+2 as the numerator and revenues as the denominator of constituent-level carbon intensities) be used for assessing decarbonisation as well as for reporting, which is in line with the recommendations of the Taskforce on Climate-related Financial Disclosures.
The proposal of the TEG also dramatically fails to enhance transparency and enable market participants to make well-informed choices when it comes to the incorporation of ESG factors into Benchmarks.
Instead of specifying how explanations on the incorporation of ESG factors should be provided as per the terms of the amended Regulation, the delegated act pertaining to benchmark statement disclosures presents long lists of ESG indicators to be computed and disclosed (over 20 for equity indices). That such extensive ESG disclosures would create significant administrative costs and material data licensing costs for Benchmark administrators as well as harm competition in the industry does not appear to be a major concern for the Commission. Interestingly, the composition of the working group that advised the Commission is skewed towards ESG data and service providers that stand to benefit from the proposal. We observe however that the proposal modifies the nature of the Benchmark statement and entails material costs for Benchmark administrators (and indirectly end-users); for either reason, it may be viewed as beyond the acceptable scope of the legislative delegation enjoyed by the Commission.
To add insult to injury, the overall informational potential of these "minimum" disclosures is low. Indeed, a material share of the mandated quantitative disclosures is in respect of metrics – ESG ratings – whose divergence frustrates the possibility of meaningful comparisons across providers and that have serious theoretical limitations as indicators of ESG performance or risks. Many of the other mandated disclosures are insufficiently standardised to support meaningful uses by investors.
We consider it critical that any indicator that is considered for inclusion into minimum disclosures beyond what is strictly required under the amended Regulation not only be theoretically relevant but also be specified and implemented in a manner that allows for meaningful comparisons across Benchmarks. In addition, the potential benefits of additional disclosure requirements should be balanced against the administrative and data procurement costs that they would create. By keeping mandatory disclosures reasonable and taking steps to minimise their cost, the Regulator would mitigate disincentives to the offering of Benchmarks pursuing ESG objectives and encourage voluntary reporting on the same bases.
In light of the above, it is critical that ESG ratings not be given regulatory endorsement and that they remain excluded from minimum disclosures. To be informative, quantitative disclosures in respect of ESG factors should be focused on exposure to desirable or controversial activities precisely defined and highly standardised. To keep cost inflation in check and ensure perfect comparability, the list of indicators should be as short as possible and an administrative body should be tasked with maintaining a public list of compliant and non-compliant issuers.
The above editorial updates and summarises the analyses and proposals of the advice given by the Technical Expert Group on Sustainable Finance as detailed in the following White Paper:
![]()
Unsustainable Proposals: A critical appraisal of the TEG Final Report on climate benchmarks and benchmarks' ESG disclosures and remedial proposals, Scientific Beta publication, February 2020
Features

Has Your Value Definition Just Expired?
Assessing the Robustness of Smart Beta Strategies
The Benefits of the High Factor Intensity Filter
Appraising the Draft Delegated Acts on Climate Benchmarks and ESG Disclosures
Has Your Value Definition Just Expired?
Many index providers claim that the book-to-price ratio is no longer a sufficient descriptor of the value factor. They argue that it has become outdated because reported book value ignores investments into intangible assets. As a solution, they propose including other valuation ratios, such as earnings-to-price, sales-to-price, cash flow-to-price or dividend yield. However, this solution overlooks a superior alternative: intangible capital can be estimated and added to the book value. We compare these alternative solutions and show that including unrecorded intangibles in the book value increases the value premium and aligns with risk-based explanations. By contrast, other valuation ratios do not add investment value beyond picking up implicit exposure to factors other than value. Such valuation ratios also fail to improve the alignment of value strategies with risk-based explanations.
Index providers increasingly question whether book-to-price provides a suitable definition of the value factor. They argue that intangible assets such as brand capital and technological know-how play an increasing role, but are not recognised in reported book values.
Many providers prefer combining several accounting ratios to define value. They argue that a composite of valuation measures using earnings, sales or cash flows will be better able to capture the true value of a stock. Such an approach builds on the insights found in Graham and Dodd (1934). This prominent book on "security analysis" provides guidance to stock-pickers on how to identify securities that are underpriced relative to their intrinsic value. A common misunderstanding of the value factor is that its definition provides a measure of intrinsic value that can be used to identify underpriced stocks.
Of course, a combination of accounting metrics does not infallibly reveal the true value of a stock. As illustrated in Exhibit 1, we can derive from first principles that – even if they are valued fairly – different firms may have discrepant accounting ratios, depending on their growth prospects and risk. Likewise, undervalued and overvalued firms may have identical accounting ratios. Valuation needs to account for investors' growth expectations and risk perceptions. Financial accounts and even analyst forecasts do not provide sufficient information. More generally, if true value could be extracted from financial and market data, there would not be an armada of active managers working hard to identify underpriced stocks.
Exhibit 1: True Value in a Dividend Discount Model
True Value in a Dividend Discount Model |
|||
Book Equity |
100 |
Required Rate of Return |
10% |
ROE |
10% |
Earnings |
10 |
Payout Ratio |
50% |
Dividends |
5 |
Scenario 1 |
Firm 1 |
Firm 2 |
Firm 3 |
Growth Rate |
6% |
5% |
4% |
Market Price |
125.00 |
100.00 |
83.33 |
True Value |
125.00 |
100.00 |
83.33 |
B/P |
0.80 |
1.00 |
1.20 |
E/P |
0.08 |
0.10 |
0.12 |
D/P |
0.04 |
0.05 |
0.06 |
Scenario 2 |
Firm 1 |
Firm 2 |
Firm 3 |
Growth Rate |
6% |
5% |
4% |
Market Price |
100.00 |
100.00 |
100.00 |
True Value |
125.00 |
100.00 |
83.33 |
B/P |
1.00 |
1.00 |
1.00 |
E/P |
0.10 |
0.10 |
0.10 |
D/P |
0.05 |
0.05 |
0.05 |
This table provides a stylised illustration to show that simple accounting ratios should not be expected to capture the true value of a stock. Three firms, which only differ in their expected future growth rate, are placed in two scenarios. The first scenario assumes that the market prices firms correctly, the second scenario allows for under- or over-valuation. The resulting accounting ratios are presented accordingly.
Identifying true value is more an art than a science and best left to active managers. The value factor was never meant to provide a view on securities valuation and does not require true values as an input. Instead, factor investing builds on insights from asset pricing that have identified patterns in the cross-section of expected returns. Exposure to the value factor captures differences in expected returns across stocks that reflect compensation for risk.
While they may not have higher volatility or higher market beta, value stocks tend to produce losses in bad times, when marginal utility of consumption is high. Investors need to be compensated for holding such risk.
Academic research has identified a detailed economic mechanism that leads value firms to suffer in bad economic times. Such firms' value is mainly made up of assets in place – rather than growth options. If assets in place are costly to reverse, such firms cannot adapt easily to reduced output in bad economic times. The value of growth firms, on the other hand, mainly consists of growth options. Such firms can delay their growth options flexibly without incurring high costs. This leads value firms to suffer more in bad economic times. Investment patterns observed for listed firms confirm that downward adjustments of a firm's capital stock are indeed more difficult than upward adjustments, and such differences help explain the value premium.
From this perspective, omitting intangible capital in the book value is problematic if it contributes to risk like physical capital does. If intangible capital is costly to reverse, holding a large stock of intangible capital may increase a firm's risk and lead to compensation for stockholders. Empirical research has shown that investment into intangible capital increases systematic risk and is indeed costly to reverse.
Intangible capital also exposes firms to shocks in financing conditions in the economy. For example, firms which rely on specialised know-how are exposed to a risk of key talent leaving the firm. Such talent dependency increases the risk exposure of firms to financing constraints, as key talent will tend to leave financially constrained firms when financing conditions deteriorate. Similarly, highly innovative firms may have to abandon R&D projects under financial stress, leading to additional losses in bad times. More generally, firms cannot use intangible assets as collateral, exposing them to a risk of tighter financing constraints in bad economic times.
There is a simple answer to the problem that reported book value excludes intangible assets: we can adjust book values to include unrecorded intangibles. The academic literature has established measures of intangible capital. Rather than dismissing book-to-price as outdated, we can update how it is measured by including intangible capital in the book value.
Economists recognised early on that intangible capital is a crucial part of firms' capital stock. In addition to physical capital (property, plant and equipment), firms invest in knowledge capital and organisation capital. Knowledge capital is created through research and development (R&D) that leads to know-how in the form of patents, improved processes, and better product quality. Organisation capital is created through investment in training, advertising and organisational design and leads to a skilled workforce, brand recognition, and customer relationships.
It follows that a standard approach to measuring intangible capital uses data on reported expenses that represent investments in this capital. In particular, R&D expenses can be reinterpreted as investment into knowledge capital, advertising expenses as investment into brand capital, and part of overheads (selling, general and administrative expenses) as investment into organisation capital.
Intangible capital represents a significant portion of firms' total capital. Exhibit 2 shows the average size of knowledge and organisation capital relative to total capital across the broad U.S. stock market. These intangible assets represent on average around 20% of total capital. Consequently, omitting them might have a material impact. There is also some support for the increasing importance of intangible assets in recent years. This is driven by a strong rise in the proportion of knowledge capital, from 3% in 1975 to 12% in 2017. The proportion of organisation capital has fluctuated around 15% throughout the past decades.
Exhibit 2: Proportion of Omitted Intangible Capital
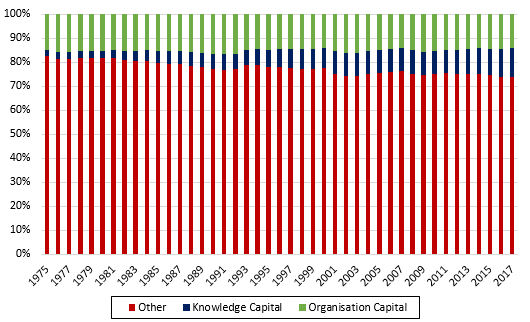
The graph shows the average percentage of knowledge and organisation capital in total capital across firms in the broad Compustat universe. The data is based on accounting statements for fiscal years ending between January 1975 and December 2017. Data source: Compustat.
Recent research1 conducted by Scientific Beta assesses an intangible-adjusted book-to-price factor and compares it to other valuation ratios. Exhibit 3 shows the various alternative value proxies compared in the study. In light of the previous discussion on the discrepancy between security valuation and the concept of the value factor, a clear dichotomy arises. On the one hand, the use of the book-to-price or the intangible-adjusted book-to-price ratios is supported by the rationale of costly reversibility of assets in place. On the other hand, valuation ratios such as earnings- or cash flows-to-price do not have a clearly identified link with the risk of value stocks. Instead, the use of these proxies is grounded in the ideas of securities valuation.
Exhibit 3: Overview of the Alternative Value Proxies Tested
Alternative Value Proxy |
Adjustment |
Book-to-Price (B/P) |
The book-to-price ratio as proposed by Fama and French (2018) |
Adjusting the Book Value for Intangibles |
|
Intangible-adjusted book-to-price (iB/P) |
Add knowledge and organisation capital to the book value, while deducting goodwill |
Using Other Valuation Ratios |
|
Sales-to-price (S/P) |
Replace book value by sales |
Earnings-to-price (E/P) |
Replace book value by earnings |
Dividend yield (D/P) |
Replace book value by dividends |
Cash flow-to-price (CF/P) |
Replace book value by cash flows |
Composites |
|
Composite of S/P, E/P, D/P and CF/P |
Average of the z-scores of the individual metrics |
Composite of B/P, S/P, E/P, D/P and CF/P |
Average of the z-scores of the individual metrics |
Exhibit 4 gives a brief overview of the performance of these alternative value factors. We find that the intangible-adjusted book-to-price factor produces a particularly strong premium of 4.8%, compared to 2.2% for the standard value factor. However, most of the alternative proxies lead to higher value premia compared to the standard book-to-price definition.
Exhibit 4: Factor Performance
Factor Performance |
B/P |
iB/P |
S/P |
E/P |
D/P |
CF/P |
Comp. exc. B/P |
Comp. inc. B/P |
Ann. Absolute Return |
2.21% |
4.82% |
4.20% |
2.95% |
-0.28% |
2.77% |
2.66% |
2.50% |
P-value |
0.08 |
0.00 |
0.00 |
0.03 |
0.90 |
0.04 |
0.05 |
0.07 |
Ann. Volatility |
9.77% |
7.93% |
9.04% |
10.74% |
9.75% |
10.27% |
10.93% |
11.19% |
Sharpe Ratio |
0.23 |
0.61 |
0.46 |
0.27 |
-0.03 |
0.27 |
0.24 |
0.22 |
Max. Drawdown |
44.44% |
28.66% |
48.83% |
54.94% |
50.08% |
50.93% |
55.39% |
56.43% |
The table shows the standalone performance measures for alternative value factors. The value factors are based on the value scores described in Exhibit 3. The time period of the analysis is July 1976 to December 2018. Data source: CRSP, Compustat, K. French database.
More important than the standalone performance, the strong premium for the intangible-adjusted book-to-price factor remains significant when accounting for exposures to other factors, at 2.09% per year. The intangible adjustment thus improves investment outcomes for multi-factor investors. For an investor who held exposure to six factors, including intangibles in the book-to-price factor increased the Sharpe ratio by more than 10% historically.
The intangible-adjusted book-to-price factor also aligns closely with the risks of the standard book-to-price factor. This alignment with a risk-based explanation is important for investors who are trying to capture a premium that will likely persist, even when it becomes widely known. The intangible-adjusted value factor leads to cyclical variation in market betas and earnings. Value stocks with high book-to-price also have higher operating leverage than growth stocks with low book-to-price when we adjust for intangibles. These observations all show that value stocks are riskier than growth stocks.
Using alternative valuation ratios does increase returns compared to book-to-price. However, this improvement is explained by implicit exposures to other factors, such as quality and low risk. When adjusting for multiple exposures, the premium of a composite value factor is not distinguishable from zero, at -0.41% per year.
It is not a surprise that some of the alternative valuation ratios result in a tilt to other factors. In particular, using earnings or cash flows results in a strong tilt towards the profitability factor. Highly profitable firms generate high earnings and will also tend to have high cash flows. Consequently, these alternative value factors lead to increased overlap with the profitability factor.
Changing from book-to-price to other valuation ratios or composites reduces the Sharpe ratio of multi-factor portfolios due to this factor overlap. Exhibit 5 illustrates this point. The red bars show the Sharpe ratio of a portfolio containing the value, low risk and profitability factors. The blue bars show the correlation of the value factor with the other two factors. Switching to other valuation ratios such as earnings- or cash-flows-to-price increases correlation with the other factors in the portfolio and reduces the Sharpe ratio. The opposite is true for the intangible adjustment, which results in a decreased correlation and an increased portfolio Sharpe ratio.
Exhibit 5: Performance of a 3-Factor Portfolio
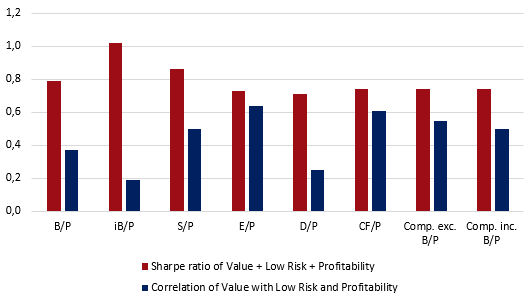
The graph shows the Sharpe ratio of a portfolio consisting of the value, low risk and profitability factors and the correlation of the value factor with the other two factors. The value factors are based on the value scores described in Exhibit 3. The time period of the analysis is July 1976 to December 2018. Data source: CRSP, Compustat, K. French database, AQR.
Combining various valuation metrics is an old recipe from the 1990s. Back then, investors did not have access to other factors, such as quality and low risk. But investment practices have changed. Many investors now hold portfolios that combine multiple factors. Therefore, picking up implicit exposure to other factors in a composite value definition does not improve investment outcomes.
Such composite value definitions may indeed be approaching their expiration date. Book-to-price on the other hand is still looking fresh, especially when unreported intangible capital is included.
Footnotes:
1”Intangible Capital and the Value Factor: Has Your Value Definition Just Expired?”, Scientific Beta white paper.
![]()
Intangible Capital and the Value Factor: Has Your Value Definition Just Expired?, Scientific Beta white paper, February 2020
Does Recent Performance of Standard Factors Justify a Factor Zoo? Comment on the Conclusions from Blitz (2020)
This short research piece provides a comment on a paper by Blitz (2020) who analyses factor performance and concludes that his "findings question the classic ambition of the asset pricing literature to reduce the entire ‘factor zoo’, i.e. the hundreds of alleged factors, to just a handful of factors that should explain the entire cross-section of stock returns. Although the Fama-French factors still have a strong long-term performance, they have by now experienced two lost decades during which various other factors were able to deliver. Thus, it seems that more factors are needed for an accurate and comprehensive description of the cross-section of stock returns".
Do we really need a factor zoo?
Blitz (2020) makes a claim that is common among active factor managers: you need many and possibly “enhanced” factors rather than a handful of standard ones. Poor recent performance of standard factors in combination with good performance of other, non-standard factors is cited as a support for this claim. However, that standard factors do not have positive returns over a given period is not a new finding. We have seen this with poor performance of value, size and low volatility in the late 1990s for example. It is what you would expect from looking at historical data for factor returns prior to 2010. The same finding holds for the equity premium, which may not be positive over extended periods of time.
The empirical analysis is also extremely simplistic. Blitz (2020) downloads factor return series from academic websites and simply computes returns over calendar decades. If this was a homework handed in by a student in an introductory portfolio management course, we would be disappointed. As a basis for criticism of the asset pricing literature, such an analysis is insufficient.
The argument that investors need different factors because the standard ones have not delivered performance over the past ten years is extremely misleading. After all, investors making decisions today require factors that perform over the next ten years, not the past ten years.
Factors do not aim to provide an accurate description of return patterns over any short time period. Instead, they are supposed to indicate sources of long-term returns. Blitz’s conclusion reflects a misunderstanding of the goals of asset pricing research and the corresponding applications in factor investing.
The remainder of this article provides further discussion of the shortcomings of the arguments in Blitz (2020).
Searching for many factors will likely result in spurious findings
The paper implies that a factor model should provide a precise description of stock returns, by stating that "more factors are needed for an accurate and comprehensive description of the cross-section of stock returns". However, the asset pricing literature does not aim to describe the cross-section with the greatest accuracy for a short sample spanning a decade. Instead, asset pricing theory tries to come up with factors that are related to long-term differences in returns and have a sound economic rationale why such patterns should persist going forward. Unsurprisingly, such factors are few. By allowing for a greater number of factors and by trying to explain more detailed price movements over short time periods, the risk of wrongly identifying spurious patterns in the data as factors increases sharply. This is why a proliferation of factors should be avoided.
Consequently, investors who wish to apply the insights from asset pricing research and benefit from factor premia need to emphasise robustness when selecting a set of factors. Harvey et al. (2016) document a total of 314 factors with positive historical risk premia and show that the discovery of the premium could be a result of data-mining. Spurious return patterns can be misidentified as statistically significant factors as long as enough researchers are searching through the same dataset. The practice of identifying merely empirical factors is known as factor fishing (see Ang, 2014; Cochrane, 2001). Therefore, a key requirement of investors to accept factors as relevant in their investment process is that there is clear economic intuition as to why the exposure to this factor constitutes a systematic risk that requires a reward, and why it is likely to continue producing a positive risk premium (Kogan and Tian, 2013). In short, factors selected just on past performance without considering any theoretical evidence are not robust and must not be expected to deliver similar premia in the future. This is emphasised by Harvey (2017), who argues that "economic plausibility must be part of the inference".
In another recent study, Chordia et al. (2017) also emphasise the factor fishing problem. They show that it is easy to find great new factors in backtests that add no real value to standard factors. They create more than two million factors based on levels, growth rates or ratios from 156 accounting variables and assess whether these factors add value beyond the value, momentum, profitability, investment, size and market factors. While they find no fewer than 22,337 great factors, the winning factor definitions do not make any economic sense. For example, it is hard to imagine why the ratio of common stock minus retained earnings to advertising expense should explain the cross-section of returns. These factor definitions also fail to survive vetting which considers multiple testing biases. In fact, from more than 20,000 factors that appear significant, none survive after adjusting for the well-known standard factors and multiple testing biases.
Hou et al. (2017) shed some light on the potential prevalence of factor fishing in practice. This paper tries to replicate a set of 452 asset pricing anomalies, which had been identified in previous studies. The authors conclude that the majority of these results fail to replicate. This finding highlights the risk that calling for more factors entails. It emphasises that it is easy to discover new factors in the data if enough fishing is done, but they will be neither economically meaningful nor statistically robust. In other words, they will not be useful for investors going forward.
A simplistic analysis that lacks rigour does not lead to meaningful conclusions
Conclusions regarding the need for more factors should follow from a rigorous empirical analysis. Blitz (2020) only presents standalone factor returns per calendar decade. These results are far from sufficient to make any meaningful conclusion for three main reasons. First, looking at calendar decades is a very specific choice and can influence results. Second, there is no indication whether results are statistically significant. Third, these results do not take into account the correlations between factors.
As indicated in the paper, the pre-2010 returns of the Fama-French factors suggest a 20% probability that the factors have a negative average performance over a decade. Including the most recent decade increases this probability to 33%. However, it is also pointed out that using 10-year rolling returns reduces this probability to 1.6%. Clearly, conclusions regarding factor performance are extremely sensitive to the starting dates of the individual decades. Furthermore, the choice of a 10-year window is also arbitrary. Using for example a 5-year window may give results that look different. Still, the author relies on these results to make his conclusions.
The paper only focusses on the levels of factor returns. It is intuitively clear that average returns in a sample period will be an unreliable indication of an asset’s long-term average returns if the asset is highly volatile. In this case, there is a high chance that the particular outcome observed is sample-specific. To take this risk of obtaining sample-specific results into account, research results are usually presented together with their statistical significance levels. Ideally, the interpretation of these levels also takes into account the amount of tests performed. The lack of significance levels in the paper, however, means that we are not able to assess whether results are likely sample-dependent or not.
The third shortcoming in the empirical analysis is that it focusses on standalone factor returns. As pointed out by Esakia et al. (2019), the investment implications of asset pricing research can be influenced by this. They show that the contribution of factors to the Sharpe ratio of a multi-factor portfolio is not necessarily in line with their standalone returns, because some factors are more highly correlated with each other than others. Describing a very rough relationship between the standard and non-standard factor returns based on calendar decades of standalone returns is not enough to say something meaningful about the correlations between the factors. To properly conclude that more factors are needed, it is necessary to explicitly account for the exposures to standard factors.
Expanding the set of factors does not benefit investors
The graph below illustrates how the results look when taking into account the three considerations mentioned above. It shows the performance of an investment in an equally-weighted portfolio of the 13 ‘other factors’ in the Hou-Xue-Zhang q-factors data library1, as defined by Blitz (2020)2. These 13 factors are themselves already aggregated, consisting of 49 underlying factors. The results thus give an idea of the performance that an investor could have achieved by considering a broad set of potential factors.
Instead of limiting the analysis to results based on calendar decades, we present results for both the full sample (blue line) and for rolling 10-year windows (red line). The use of rolling windows provides a more complete picture of the various performances investors would have experienced over 10-year periods with different starting points. Next, the results are presented as t-statistics instead of returns, which makes it possible to interpret the results in light of their statistical significance. Finally, we explicitly control for exposures to the factors proposed by Hou et al. (2020), and consequently assess the alphas from a spanning regression. Their q5 factor model3 reduces the factor zoo of the 49 factors in the investor’s portfolio to only 5 factors.
The graph gives a clear picture. The added value that an investor can obtain by investing in a broad set of factors, as opposed to sticking to a more limited set of 5 factors, is not significant. Over the full sample, the value of the alpha is well within the conventional significance bounds. The rolling alphas fluctuate around zero over time, which is in line with the non-significance of the full sample result. Any outperformance that is observed over a specific 10-year period is likely sample-specific. Hence, for investors who want to harvest return premia of long-term rewarded factors going forward, there is no clear case to expand the number of factors in their portfolio beyond a limited set of standard factors.
Figure 1: Added Value of a Broad Set of Factors over the Factors in a Standard Model
Conclusion
For investors, fishing for factors that have won in the past does not add value. Instead, investors benefit from focusing on finding factors that are supported by sound theory and empirical evidence. There is a limited number of such factors, which have passed the high hurdle of peer-reviewed assessment and scrutiny in the academic literature. An ad-hoc analysis of short term performance that does not even pass the mildest standards of research quality is not suitable to question the broad evidence on factors.
Footnotes:
1http://global-q.org/index.html.
2Blitz (2020) aggregates individual factors based on the various decile portfolios available in the data library in the following 13 composite factors: Size, Value, Payout yield, Profitability, Accruals, Investment, Intangibles, Price momentum, Analyst revisions, Earnings momentum, Seasonals, Short-term reversal and Low-risk.
3Data for these factors also come from the Hou-Xue-Zhang q-factors data library, where they are constructed from 1972 onwards by Hou, Xue, and Zhang (2015), extended back in time by Hou, Mo, Xue, and Zhang (2019) and augmented with expected growth by Hou, Mo, Xue, and Zhang (2020).
Assessing the Robustness of Smart Beta Strategies
Concerning actual investment decisions, assessing the robustness of smart beta strategies should play a central role for investors in their due diligence process. Such strategies often experience an out-of-sample degradation of their performance compared to that presented in the historical in-sample period. Investors should always check that interesting in-sample results are complemented by a consistent construction framework and transparency on the methodology and implementation from the side of the strategy provider. This evaluation of the robustness by design needs to be completed by an empirical analysis. This article describes the sources of a lack of robustness in the design of the indices and explains the need for robustness checks in performance analysis of such strategies and the various methods by which Scientific Beta improves robustness.
As a complement to this analysis of the robustness of the construction method of smart beta strategies, investors should also be able to measure robustness directly using appropriate tools and metrics in order to cross-check whether the strategy's behaviour is consistent with its stated objective. However, assessing the robustness of a strategy based on historical simulations can become challenging due to sample dependence. For this reason, we discuss appropriate measurements of robustness and describe the robustness protocol that we employ to evaluate the robustness of strategies under scrutiny. This toolkit of robustness tests is quite relevant to investors and can be used in their evaluation of smart beta strategies.
1. Robustness issues in the design of factor strategies and how to improve robustness
In this section, we explain what we mean by robustness in the design of factor strategies. A strategy is assumed to be 'relatively robust' if it is able to deliver similar outperformance under similar market conditions by aligning well with the performance of underlying factor exposure it is seeking and reducing unrewarded risks. The relative robustness approach applies generally to single-factor strategies. It ultimately involves checking whether the strategy benefits as much as possible from conditions that are favourable to the factors while at the same time limiting its risks of underperformance. 'Absolute robustness' refers to a strategy that is shown to outperform irrespective of prevailing market conditions. This is notably the case for multi-factor strategies, for which it is expected that the multi-factor diversification will allow them to perform whatever the factor conditions.
A lack of robustness in smart beta strategies can be caused mainly by exposure to three different risks in the strategy construction process. Two are sources of a lack of relative robustness, namely factor fishing and factor redundancy as well as non-robust weighting schemes. The third, often referred to as high factor dependencies, generates a lack of absolute robustness.
Scientific Beta proposes three solutions by which robustness of smart beta strategies can be improved.
As an illustration, we provide a list of multi-factor products offered by different providers and we highlight flaws in the robustness of their design (see Exhibit 3).
Finally, we highlight the need for transparency that enables investors to independently verify the performance reported by the providers.
1.1 Sources of a lack of robustness and solutions
Factor fishing risks and factor redundancy – Cause a lack of relative robustness
Harvey et al. (2016) document a total of 314 factors with positive historical risk premia showing that the discovery of the premium could be a result of data mining (i.e. strong and statistically significant factor premia may be a result of many researchers searching through the same dataset to find publishable results). The practice of identifying merely empirical factors is known as 'factor fishing' (see Ang, 2014; Cochrane, 2001). Therefore, a key requirement of investors to accept factors as relevant in their investment process should be that there is clear economic intuition as to why the exposure to this factor constitutes a systematic risk that requires a reward, and why it is likely to continue producing a positive risk premium (Kogan and Tian, 2013).
Among competitor strategies, we see a proliferation of factor definitions (see Exhibit 3). This is a negative sign for investors as these factor choices often depart from the definition of a factor risk premium as documented in academic studies and the economic rationale underpinning their existence. Take for example, the Value factor risk premium. The risk-based economic rationale, which is closely linked to the definition of Value, is the costly reversibility of assets in place. Value companies have a lower P/B ratio since these companies have a higher book value (assets in place) relative to their market capitalisation. The irreversibility of assets in place means that Value companies will be more sensitive to economic shocks in bad times, exposing investors to a risk of losses when their economic situation is already poor, their consumption is low and marginal utility of consumption is high. The risk premium is compensation to investors who are willing to take this additional risk by explicitly tilting towards this factor. Competitor strategies, however, do not rely on this univariate definition of Value as follows by its economic rationale, and instead choose composite multiple-variable definitions or economic proprietary models to define the Value factor. This choice opens the door to higher degrees of freedom in the index design, and higher risk of data mining.
Our analysis below shows that various alternative Value definitions fail to outperform the P/B metric out-of-sample despite their superiority during the in-sample search. Every year between 1984 and 2009, a 5Y formation period is used to pick the best portfolio based on alternative Value definitions and this portfolio is held for another 5 years. Exhibit 1 plots the average outperformance pre- and post-formation with respect to the Book-to-Market portfolio. The chart clearly shows that the average alternative variable definition ultimately underperforms the Book-to-Market and drives the cumulative relative returns way below zero. Picking the past winner yields cumulative outperformance over book-to-market of +1.79% in-sample. However, over the following five years, having picked the in-sample winner leads to an out-of-sample cumulative underperformance of -2.72%. This analysis demonstrates that alternative Value definitions hardly present a suitable replacement for Book-to-Market overall.
Exhibit 1: Comparison of Cumulative Relative Returns of the Average Best In-Sample Alternative Value Strategy with Respect to a Portfolio Based on Book-to-Market
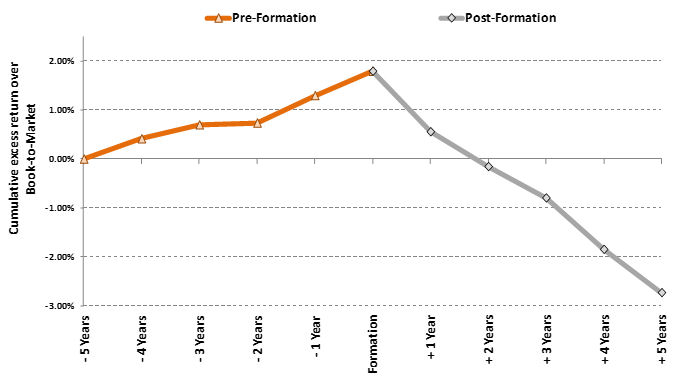
This chart plots the cumulative excess returns of ten annually rebalanced cap-weighted Value tilted strategies with 50% stock selection out of the universe of 500 US stocks based on ten alternative Value strategies, with respect to a similarly constructed portfolio based on Book-to-Market. Between 1984 and 2009, a five year formation period is used to pick the best portfolio based on alternative Value definitions and this portfolio is held for another five years. This is done every year for a total of 26 event studies. The chart plots the average outperformance pre- and post-formation with respect to the Book-to-Market portfolio. The alternative Value definitions are Earnings-to-Price, Cash-flow-to-Price, Sales-to-Price, Dividend-to-Price and Payout-to-Price, both plain-vanilla and sector neutral versions for each. The graph is smoothed by using yearly values.
It becomes clear that factor fishing issues arise from multiple tests of candidate variables where a product provider chooses a single variable among a vast range of candidate variables based on backtested performance. The resulting bias may be referred to as a "selection bias". To make things worse, there is an additional bias that is specific to composite scoring approaches – factor definitions which draw on combinations of multiple variables, such as those widely used by competitor indices. The paper by Novy-Marx (2015) analyses the bias inherent in backtests of composite scoring approaches.1 Novy-Marx argues that the use of composite variables in the design and testing of smart beta strategies yields a "particular pernicious form of data-snooping bias". He shows that creating a composite variable based on the in-sample performance of single variable strategies generates an over-fitting bias. To make matters worse, this over-fitting bias interacts with the selection bias. The presence of both biases in composite variable smart beta strategies increases the data mining problems exponentially.
The same issue arises with the definition of a Quality factor. The academic literature has proven that two distinct factors exist under the umbrella of a Quality definition, namely the High Profitability and Low Investment factors. Quality factor propositions, however, do not make this distinction and instead rely strongly on composite variable definitions – in one competitor case, even 10 variables are combined. This leads to Quality portfolios comprising of 'grey' stocks, i.e. stocks that do not offer exposure to either of the two well-rewarded factors.
To illustrate such risks of using non-standard factors, Exhibit 2 shows the factor exposures and performance attribution of the excess returns of the MSCI World Quality Index. This index is based on a non-standard composite Quality factor definition. It is interesting to assess how this index is exposed to the two standard quality factors in the academic literature, Profitability and Investment. The exposure to Profitability is clear with a beta of 0.39. However, the exposure to the Investment factor is around zero. This is contrary to what is expected from a Quality index. Furthermore, the exposures to the Market, Size and Value factors are negative. Obtaining significant negative exposures to factors that are unrelated to Quality is an important, presumably unintended, consequence of investing in this Quality index. The last column shows that only 31.79% of the impact on the excess returns is driven by the Quality factors. This means that non-Quality related factors and idiosyncratic risk are the main drivers of how this index performed relative to the cap-weighted index. This misalignment with investment objectives may be present in any index based on non-standard factor definitions. Hence, proprietary factor definitions lead to a risk of misunderstanding factor exposures.
Exhibit 2: Exposure of Composite Quality Factor Index Excess Returns to Standard Factors
MSCI World Quality Index |
Exposure (beta) |
t-stat |
Performance Attribution |
Impact on Performance |
Ann. Alpha |
0.01 |
1.75 |
0.96% |
30.04% |
Market |
-0.06 |
-8.82 |
-0.47% |
14.65% |
Size |
-0.20 |
-12.15 |
-0.29% |
9.18% |
Value |
-0.26 |
-13.49 |
-0.31% |
9.69% |
Momentum |
0.04 |
4.79 |
0.15% |
4.64% |
Profitability |
0.39 |
15.01 |
1.01% |
31.67% |
Investment |
0.00 |
-0.14 |
0.00% |
0.12% |
R2 |
64.06% |
Total |
1.04% |
100.00% |
The analysis is based on weekly return data for the period starting on 20 June 2002 and ending on 30 June 2018. The first two columns show the regression betas together with their t-statistic. The third column shows how much of the annualised excess return of the index can be attributed to the different factors based on their average returns and the exposures. The last column shows the relative size of the impact each of the factors had on the index excess returns, calculated as the absolute value of its performance attribution divided by the sum of the absolute values of the performance attributions. Data source: Bloomberg, French data library.
Alternative or new factor definitions may also be redundant with respect to consensus factors from the academic literature. In fact, many proprietary factors may have return effects, which can be explained away by the fact that they have exposures to standard factors (see Fama and French, 1996). Popular factor products and tools contain a large number of factors that do not deliver an independent long-term premium. This is bad news for investors who are using such tools to understand the long-term return drivers of their portfolios.
The Dividend Yield is a characteristic example of a redundant factor and is employed in competitor products. Our analysis shows that the Dividend Yield factor does not lead to significant returns (see also an extensive analysis in Amenc, Goltz and Luyten, 2020). Moreover, when adjusting returns for the exposure to the standard Value (book-to-market) effect, the Dividend Yield factor actually delivers negative returns.
A common theme that we observe across most factor providers is that of creating different products over time that end up with inconsistencies in the construction and factor choices. This common practice increases risks for investors (data-mining risks in particular), a topic that we have thoroughly discussed in our white paper "Inconsistent Factor Indices: What are the Risks of Index Changes?".
Assume we take MSCI as an example and the two multi-factor indices offered to investors (see Exhibit 3). The MSCI USA Diversified Multiple-Factor product targets four factors and excludes Low Volatility. However, the missing Low Volatility factor is otherwise offered as an individual product and is also part of the second multi-factor index, MSCI USA Factor Mix. The latter index includes two of the factors (Value, Quality) that are part of the former but further excludes Momentum and Low Size. The inconsistencies in factor choices are obvious. Similarly for FTSE, we see that their first index, FTSE Russell 1000 Comprehensive Factor, targets five factors (Quality, Value, Momentum, Low Volatility and Size) while the second index, FTSE JP Morgan Diversified Factor US Equity, targets three (Value, Momentum and Quality). Methodologies between indices also differ considerably (see Exhibit 3 for a summary), thus increasing inconsistencies further between products of the same provider. From that viewpoint, even though research and the positions taken by major industry players should be guidelines for investors, the increasing number of conclusions and investment beliefs, while allowing these players to ensure, with products that have such contrasting characteristics, that they can always hope to have one that performs well in a particular sample, are to the detriment of the out-of-sample robustness that a long-term investor has the right to expect.
Solution – Avoidance of data mining with a consistent framework. A very effective mechanism to avoid data mining is to establish a consistent framework. Consistency in the index framework prevents model mining by limiting the number of choices by which indices can be constructed. An index that performs well across multiple specification choices is more robust than an index that performs only in a single specification choice, which could very well have been by chance. Scientific Beta uses a consistent smart beta index design framework for the construction of its entire set of smart beta indices known as the Smart Beta 2.0 approach (Amenc, Goltz and Martellini, 2013). In this approach to index construction, a clear separation of the selection and weighting phases is done which enables investors to choose the risks to which they do or do not wish to be exposed. In particular, stock selection is based on robust univariate definitions for a small number of factors that have been academically proven and documented over multiple studies and using long-term data covering different universes and data samples, namely Size, Value, Momentum, Low Volatility, High Profitability and Low Investment.
Lack of robustness of weighting schemes – Cause of a lack of relative robustness
All smart beta strategies are exposed to systematic risk factors but also to strategy-specific risks which are unrewarded in the long run, and therefore not ultimately desired by the investor. Strategy-specific risks give rise to the lack of robustness of weighting schemes. A globally effective diversification weighting scheme reduces the quantity of unrewarded risks such as stock-specific idiosyncratic risks or exposure to risk factors that are unrewarded in the long term, e.g. commodity, currency or sector risks.
A common theme across the suite of products examined (see Exhibit 3) is that these strategies use factor scores as a measure of factor exposure in determining the portfolios. The major drawback factor scores suffer from is "double counting" of exposures, which is due to their lack of regard for the correlation structure of factors. A factor strategy that optimises allocation according to factor scores can easily end up with sizeable negative exposures to most of the other rewarded factors. Concentration will be an additional issue leading to an increase of unrewarded (idiosyncratic) risk taken.
Solution – Avoidance of unrewarded risks. The true Maximum Sharpe Ratio (MSR) portfolio is the only portfolio that contains zero unrewarded risk. Proxies for MSR portfolios suffer from the error associated with the estimation of expected returns. Since academic research has not produced any solution to the problem of expected return estimation – and factor scores are implicit expected return estimates – it is more useful to employ weighting schemes that focus on a robust risk parameter estimation, since extant academic literature proposes numerous approaches to improve statistical estimation of risk parameters. A well-diversified weighting scheme provides efficient access to the risk premia associated with a factor exposure. The idea is to construct an investable proxy for a risk factor while reducing unrewarded risks through the use of a well-diversified weighting scheme.
Strong dependency on individual factor exposures – Cause of a lack of absolute robustness
The economic intuition for the existence of a reward for a risk factor is that exposure to such a factor is undesirable for the average investor because it leads to losses in bad times (i.e. when marginal utility is high, see Cochrane, 2001). Thus, risk factors will have prolonged periods of bad performance and each factor will underperform at different time periods. Therefore, exposure to a single factor is not a robust approach in absolute terms as the investor will be exposed to the risk of underperforming the broad market benchmark when the factor underperforms.
Another common choice across competitor multi-factor products (see Exhibit 3) is the concentration in a few factors among those that are documented to deliver a long-term reward, even if the provider is offering the excluded factors as standalone products. Other competitor strategies even concentrate on a particular factor and control for a handful of others, essentially leading to factor-concentrated products (instead of factor-diversified multi-factor ones).
Solution – Avoiding concentration in a single factor. Investors who rely on exposure to a single factor accept the risk that the underlying factor is likely to underperform for short periods. In fact, the reward for exposure to rewarded factors has been shown to vary over time (see e.g. Harvey, 1989; Asness, 1992; Cohen, Polk and Vuolteenaho, 2003). Using smart beta indices as well-diversified ingredients with exposure to the six well-rewarded risk factors, a strong intuition suggests that combining factor tilts, or "multi-beta allocations", will tend to result in improved risk-adjusted performance.
It should be noted that the more a single factor index is concentrated in respect of a given factor, the more likely it is to be poorly exposed to other factors, in particular to those that tend to be antagonistic with the targeted factor (across or in certain market states). In this sense, multi-factor allocations would be detrimental to performance as factor dilution will prevail, cancelling targeted exposures to rewarded factors. Therefore, and in order to diversify the factor allocations well, it is necessary to take account of the cross-sectionalities and the variations in factor intensities between single factor indices. Quite importantly, our High Factor Intensity (HFI) filter integrates the cross-sectional variability of factor intensity over time and across the six well-rewarded factors and offers protection against negative exposure to other rewarded factors in the single factor sleeve construction. These resultant highly efficient single smart factor indices are then appropriate building blocks for a robust multi-smart factor allocation.
Exhibit 3: Design of Competitor Multi-Factor Products
Category |
Methodology |
Factor Definitions |
Weighting Scheme |
FTSE Russell 1000 Comprehensive Factor
|
Bottom-up approach to multi-factor allocations, known to lead to concentrated portfolios. | Value and Quality definitions based on composite variables, known to increase degrees of freedom and introduce data mining risks. | Sequential multiplicative tilts, around market cap weights known to lead to concentrated portfolios. |
| FTSE JP Morgan Diversified Factor US Equity | Sector balanced allocation by inverse sector volatility, but sector not a rewarded risk relative to the benchmark. Arbitrary choice of factors: Targets three factors, while JPM offers five factors as individual products. | Two factors (dividend yield and low volatility) otherwise offered as separate products are sub-components of composite Value (1/4 variables) and Quality (1/10 variables) definitions. Further arbitrary choice to split Quality in three families of the 10 total variables. | Targets higher weight for stocks with higher multi-factor scores – however, stock level characteristics are noisy and expected returns not linear with factor exposure. |
| MSCI USA Diversified Multiple-Factor | Arbitrary choice of factors: Targets four factors, but excludes low volatility which otherwise is offered as an individual product. | Value and Quality definitions based on composite variables, known to increase degrees of freedom and introduce high data mining risks. | Bottom-up optimisation to maximise portfolio alpha score (equal-weight factor score per stock) including multiple constraints. Leads to selection of "grey" stocks that are not exposed prominently to any factor but simply have high average factor exposure. |
MSCI USA Factor Mix
|
Arbitrary choice of factors: Targets three factors, with a mixed selection relative to their Diversified Multi-Factor product (Value, Quality included in both, but now Low Volatility is included instead of Momentum and Low Size) | Proprietary models used in MSCI Minimum Volatility which constitutes a part of this index. | Top-down equal factor allocation which is in contrast with the bottom-up optimisation approach in their Diversified Multi-Factor product. |
| S&P GIVI US | No explicit factor selection, whereby high volatility stocks are excluded and the investable universe of stocks is weighted according to a composite model of Value & Profitability factors. | Proprietary model (Residual Income Model) used to define the intrinsic value for each company, which is then used to weight stocks. The model uses metrics of Value and Profitability factors. | Weighting scheme depends on stock-level factor metrics which are known to be noisy and makes the wrongful assumption that individual stock-level expected returns are proportional to stronger factor measurements. |
| RAFI Multi-Factor U.S. Index | Strong dependence on their fundamental weighting definition (based on four accounting measures related to the Value factor) which underpins universe construction, stock selection and individual factor sleeve weighting. | Value, Quality and Momentum definitions based on composite variables. Low Volatility based on a metric extracted from a multiple regression of stock returns against global, countries and industry groups. Size is not a standalone factor portfolio but rather a multi-factor portfolio of the four other factors in small size universe segment. | Value, Low Volatility, Quality are fundamentally-weighted and carry a strong dependence on a proprietary definition to weight portfolios, while Momentum is cap-weighted which is known to produce concentrated portfolios. |
| RAFI Dynamic Multi-Factor U.S. Index | Same as above, and additionally employs timing of factors based on momentum and reversal signals, while research shows inferiority of factor timing relative to well-balanced multi-factor portfolios. | ||
| AQR Large Cap Multi-Style Fund | Arbitrary choice of three factors: value, momentum and profitability. It is not an index and therefore the methodology is not entirely transparent. | All factor definitions based on composite variables, known to increase degrees of freedom and introduce data mining risks. | Security weighting is discretionary/proprietary with mentions of liquidity concerns. |
| DFA US Core Equity | Claims of exposure to three factors: Size, Profitability and Value. It is not an index and therefore the methodology is not entirely transparent. | Analysis of construction methodology shows that this is a single factor index (Size index) which reduces negative interaction with other two well rewarded factors. | No clear indication of stock weighting mechanism. Size factor is explicitly targeted through stock selection and then stocks with Low Profitability and Growth are eliminated. |
1.2 Importance of transparency
Transparency means the disclosure of at least the index's objectives and its key construction principles, complete information on the calculation methodology, and historical data on constituents and weights. Index transparency is necessary to replicate and validate the track records reported by index providers.
Scientific Beta offers full transparency on its index construction methodology. This is based on unambiguous ground rules, the historical values, constituents and their weights, various performance measures and documentation on how they are computed and long-term track records.
2. Measuring robustness
2.1 Robustness protocol
Measuring the robustness of smart beta strategies is important to have a proper understanding of the stability of their performance and risks in different market environments or under changing assumptions. Therefore, the robustness of strategies should be thoroughly tested before investors implement them. This ensures that investors can understand the performance and risks and know what reasonable expectations for the strategies under different circumstances are. For this purpose, Scientific Beta has developed its own robustness protocol. This protocol covers five main dimensions of robustness:
i. Factor Exposure – First, we analyse the risk exposure of the strategy to the market and the six well-rewarded factors2. This is a particularly important robustness check because it allows the investor to measure the factor intensity of a strategy, its factor deconcentration and its factor exposure quality. Factor intensity (sum of non-market factor betas) measures the strength of factor exposures. Factor deconcentration (inverse of the sum of squared relative betas) measures the diversification of factor exposures of a portfolio. If factor exposures are perfectly diversified, i.e. the same exposures to all risk factors, then the ratio is equal to six. Factor exposure quality (product of factor intensity and factor deconcentration) reveals if factor intensity goes hand-in-hand with a more balanced factor exposure. Well-balanced exposures are the key to robustness and this part of the protocol gives you a very good indicator of factor strength and factor diversification quality;
ii. Conditional Performance – Analysing the conditional performance of the smart beta strategies in bull-bear market conditions or under different macroeconomic conditions is a powerful tool in robustness analysis because their performance is shown to depend significantly on macroeconomic state variables (Amenc et al., 2019). We look at the relative performance of smart beta indices under a variety of states, including bull and bear return or volatility periods relative to the market, sectors, factors or macroeconomic variables;
iii. Stability of Performance: Rolling Statistics and Outperformance Probability – Long-run average statistics on risk measures can hide serious fluctuations in these numbers over shorter periods. Therefore, we compute a set of rolling statistics for the strategy. This enables us to assess the stability and the extreme values of these measures. In addition, we compute the Probability of Outperformance, defined as the empirical frequency of outperforming the cap-weighted reference index over a given investment horizon. Its objective is to assess the sensitivity of a strategy's performance to its entry point;
iv. Robust Inference – We also want to know how a new strategy compares to a given benchmark. Simply comparing risk-adjusted returns of the two strategies and concluding that the highest one is reliably better would ignore the fact that we work with only a sample of data and the potential for data mining in the design. To assess whether an observed difference is statistically significant, we conduct a hypothesis test as per Ledoit and Wolf (2008) to test for Sharpe ratio differences;
v. Out-of-sample Tests – Sample specific patterns can always influence the obtained results. Therefore, it is necessary to conduct out-of-sample tests to ensure that the results also hold in different datasets. We calculate and check that the key statistics of interest for a strategy align for a different and longer data sample using our long-term US dataset of more than 45 years length.
2.2 Measuring robustness of multi-factor products
In this part, we employ a battery of tests according to our robustness protocol across the set of multi-factor strategies shown in Exhibit 33. We also add into the analysis the Scientific Beta High-Factor-Intensity Diversified Multi-Beta Multi-Strategy 6-Factor 4-Strategy EW (SciBeta HFI Div MBMS 6F 4S EW) index, including the version with the Market Beta Adjusted (MBA) risk control.
This allows us to quantitatively evaluate if the proposed objectives of these strategies are met in practice, measure their overall robustness and identify the issue of poor factor diversification and factor conditionality observed in these strategies. Instead, we get to see that Scientific Beta multi-factor indices benefit from good factor diversification which reduces conditional dependencies of our strategies and increases confidence for good expected out-of-sample outperformance.
Exhibit 4: Risk Factor Exposure of Competitor and Scientific Beta Indices
10 years
to 31-Dec-2019, in USD |
FTSE Russell 1000 Comprehensive Factor
|
FTSE JP Morgan Diversified Factor US Equity
|
MSCI USA Diversified Multiple-Factor
|
MSCI USA Factor Mix
|
S&P GIVI US
|
RAFI Multi-Factor U.S. Index
|
RAFI Dynamic Multi-Factor U.S. Index
|
DFA US Core Equity
|
Average of Competitors |
SciBeta HFI US MBMS 6F 4S EW |
|
Standard |
MBA (Overlay) |
||||||||||
Unexplained |
0.99% |
0.19% |
0.37% |
0.19% |
-0.02% |
-0.13% |
-0.02% |
0.19% |
0.22% |
0.23% |
0.46% |
Market |
0.94 |
0.91 |
1.01 |
0.90 |
0.90 |
0.96 |
0.97 |
1.06 |
0.96 |
0.88 |
1.01 |
SMB |
0.27 |
0.16 |
0.14 |
0.02 |
0.09 |
0.18 |
0.17 |
0.24 |
0.16 |
0.12 |
0.12 |
HML |
0.07 |
0.02 |
0.14 |
0.00 |
0.05 |
0.01 |
0.02 |
0.05 |
0.04 |
0.07 |
0.07 |
MOM |
0.08 |
-0.01 |
0.06 |
-0.02 |
-0.06 |
0.04 |
0.09 |
0.03 |
0.03 |
0.04 |
0.04 |
VOL |
0.12 |
0.15 |
0.02 |
0.12 |
0.13 |
0.07 |
0.06 |
-0.05 |
0.08 |
0.16 |
0.15 |
PRO |
0.09 |
0.03 |
0.12 |
0.07 |
0.08 |
0.06 |
0.05 |
0.04 |
0.07 |
0.16 |
0.16 |
INV |
0.02 |
-0.02 |
0.05 |
0.02 |
0.01 |
0.15 |
0.13 |
0.05 |
0.05 |
0.09 |
0.09 |
Factor Contribution |
0.75% |
1.22% |
-0.11% |
1.61% |
1.40% |
0.75% |
0.56% |
-1.14% |
0.63% |
2.04% |
2.06% |
Factor Intensity |
0.65 |
0.34 |
0.54 |
0.20 |
0.31 |
0.50 |
0.52 |
0.37 |
0.43 |
0.63 |
0.63 |
Factor Deconcentration |
3.84 |
2.24 |
4.65 |
2.00 |
2.59 |
3.96 |
4.35 |
1.96 |
3.20 |
5.14 |
5.11 |
Factor Exposure Quality |
2.48 |
0.77 |
2.50 |
0.40 |
0.81 |
1.98 |
2.24 |
0.72 |
1.49 |
3.24 |
3.22 |
The analysis is conducted from 31/12/2009 to 31/12/2019 on USD total returns. The Scientific Beta US cap-weighted index is used as the cap-weighted reference. The regressions are based on weekly total returns. The three-month US Treasury bill rate is used as the proxy for the risk-free rate. Factor exposures are based on a seven-factor model. The Market factor is the excess return series of the cap-weighted index of all stocks that constitute the index portfolio over the risk-free rate. The SMB factor is the return series of an equal-weighted portfolio that is long small-cap stocks and short for the top 30% stocks ranked by market capitalisation (large market-cap stocks). The HML factor is the return series of an equal-weighted portfolio that is long for the top 30% stocks (Value stocks) and short for the bottom 30% stocks (Growth stocks) sorted on book-to-market value in descending order. The MOM factor is the return series of an equal-weighted portfolio that is long the winner stocks and short the loser stocks. The winner stocks (inversely the loser stocks) are defined as the top 30% (inversely the bottom 30%) of stocks, sorted on the past 52 weeks' compounded returns excluding the most recent month, in descending order. The Low Vol factor is the return series of an equal-weighted portfolio that is long the bottom 30% stocks (Low Volatility stocks) and short the top 30% stocks (High Volatility stocks) sorted on past volatility in descending order. The High Profitability factor is the return series of an equal-weighted portfolio that is long the top 30% stocks (High Profitability stocks) and short the bottom 30% stocks (Low Profitability stocks) sorted on gross profitability in descending order. The Low Investment factor is the return series of an equal-weighted portfolio that is long the bottom 30% stocks (Low Investment stocks) and short the top 30% stocks (High Investment stocks) sorted on two-year asset growth in descending order. The factors are market beta neutralised ex-post on a quarterly basis. Factor intensity is the sum of non-market beta exposures. Factor deconcentration is the inverse of the sum of squared relative betas. Relative betas are each individual non-market factor beta divided by factor intensity. Factor Exposure Quality is the factor intensity multiplied by factor deconcentration. Factor Performance Contribution is the sum of factor contribution of each non-market factor over the period.
The risk factor exposure analysis in Exhibit 4 can reveal which factors the multi-factor indices were actually exposed to. Some competitive indices exhibit negative betas on factors which imply that they will be penalised from the long-term positive risk premium of the particular factor. Many show a low factor intensity (sum of non-market factor betas) which indicates poor factor exposures and as a result suffer from low factor contribution as depicted in the table. In addition, the factor deconcentration metric is a measure of factor diversification and for most competitor indices it is far from an optimal exposure of 6 which implies balanced allocation to all six rewarded risk factors.
Instead, Scientific Beta indices benefit from a dynamic multi-factor HFI filter4 that ensures that the factors' non-null cross-sectionality does not have an excessive impact either on the overall factor intensity or on the balance of the factor exposures. Given that the factor intensities are highly variable over time across the six factors, this filter's dynamic adjustment is important and over the medium term provides very good factor balance and an exposure quality that is much better than competitors'. We underline that our multi-factor indices deliver better factor intensity and factor deconcentration compared to the competitors' average. The factor intensity of our multi-factor index is 47% higher (0.43 against 0.63) over the last ten years than competitors that do not take account, for most of them, cross-factor interactions because they rely on scores and bottom-up construction approaches. Moreover, its factor deconcentration and factor exposure quality are 61% (3.20 against 5.14, similar for MBA) and 118% (1.49 against 3.24, similar for MBA) higher compared to the average competitors respectively over the last ten years. We underscore that, over the long-term, only strategies with well-balanced factor exposures and strong factor exposure quality can deliver strong factor contributions.
Exhibit 5 summarises the output for our robustness protocol including a summary of factor exposures as depicted in Exhibit 4. Numerical results highlight some of the robustness issues that were evident in the design phase. The Sharpe ratio test fails for the majority of competitor indices highlighting that differences with the benchmark are non-existent once data mining biases are accounted for properly. The two indices that pass the test are, however, among the lowest in terms of factor quality as a result of their low and concentrated factor exposure. This may be a negative sign for their robustness out-of-sample, as their outperformance was strongly dependent on a very low number of factors which may or may not outperform in the subsequent period. Instead, we see that the +0.17 Sharpe ratio differences for the Scientific Beta indices are significant according to the econometric test, accompanied by healthy factor quality metrics.
High conditionality on certain states of the market are also evident for most competitor indices (with conditional ratios close or equal to the upper limit) which indicates high dependency on certain states of the economy. The outperformance probability metric highlights that many strategies' outperformance tends to disappear with longer horizons. This is quite disappointing for multi-factor strategies that are sold with the promise of long-term outperformance due to their factor characteristics. Instead, we see outperformance probabilities that decline over time which shows that investors expecting long-term outperformance may face poor financial consequences. On the other hand, we see a healthy (strong and upward sloping) term structure of outperformance probabilities for the Scientific Beta indices which highlights their usefulness as long-term vehicles for outperformance.
The rolling statistics' part of the protocol allows us to assess the distribution of risk measures such as the volatility and the tracking error, and enables one to avoid sticking with average indicators which are not necessarily representative of the sample risk. We observe that some strategies can exhibit extreme values for certain risk metrics, thus highlighting the need to go beyond long-term average statistics in the evaluation of strategies. See for example the 4.9% extreme tracking error (TE) of the FTSE Russell 1000 Comprehensive or the 20.2% extreme volatility of the DFA US Core Equity. Finally, the out-of-sample analysis part of the protocol requires availability of strategy data and methodology in order to simulate it over the long-term US dataset. Since these are not available for competitor strategies we cannot apply this part of the analysis on them.
Exhibit 5: Robustness Synthesis of Competitor and Scientific Beta Indices
10 years
to 31-Dec-2019, in USD |
FTSE Russell 1000 Comprehensive Factor
|
FTSE JP Morgan Diversified Factor US Equity
|
MSCI USA Diversified Multiple-Factor
|
MSCI USA Factor Mix
|
S&P GIVI US
|
RAFI Multi-Factor U.S. Index
|
RAFI Dynamic Multi-Factor U.S. Index
|
DFA US Core Equity
|
Average of Competitors |
SciBeta HFI US MBMS 6F 4S EW |
|
Standard |
MBA (Overlay) |
||||||||||
Robust Inference: Sharpe Ratio Test vs. BM |
|||||||||||
Difference in Sharpe Ratio |
0.11 |
0.10 |
0.01 |
0.15 |
0.11 |
0.04 |
0.04 |
-0.08 |
0.06 |
0.17 |
0.17 |
| P-value | 21.50% |
14.60% |
90.85% |
0.07% |
2.85% |
48.26% |
57.69% |
15.73% |
n/r |
2.19% |
1.04% |
Conditional Ratios |
|||||||||||
Macro* |
0.30 |
0.45 |
0.30 |
0.72 |
0.68 |
0.33 |
0.27 |
0.54 |
0.45 |
0.37 |
0.19 |
Market |
1.61 |
1.98 |
0.99 |
1.94 |
1.99 |
1.98 |
1.92 |
2.00 |
1.80 |
1.90 |
0.49 |
Factors |
1.24 |
1.96 |
1.35 |
1.81 |
1.91 |
1.91 |
2.00 |
2.00 |
1.77 |
1.70 |
0.57 |
Sectors |
0.93 |
1.56 |
1.25 |
1.67 |
1.99 |
1.41 |
1.24 |
1.99 |
1.50 |
1.29 |
0.43 |
Outperformance Probability over Benchmark |
|||||||||||
1 Year |
60.6% |
51.4% |
60.6% |
54.1% |
53.2% |
55.0% |
56.0% |
41.3% |
54.0% |
56.9% |
81.7% |
3 Years |
72.9% |
68.2% |
72.9% |
76.5% |
64.7% |
55.3% |
54.1% |
38.8% |
62.9% |
71.8% |
91.8% |
5 Years |
73.8% |
60.7% |
73.8% |
88.5% |
50.8% |
49.2% |
52.5% |
34.4% |
60.5% |
96.7% |
100.0% |
Rolling statistics (3Y Rolling Window) |
|||||||||||
| 5% Worst Rolling Vol | 18.1% |
16.8% |
18.7% |
15.8% |
16.1% |
17.8% |
18.3% |
20.2% |
17.7% |
16.3% |
18.9% |
5% Worst Rolling TE |
4.9% |
3.5% |
3.4% |
2.8% |
2.7% |
3.0% |
2.8% |
3.2% |
3.3% |
3.5% |
3.0% |
Factor Exposures |
|||||||||||
Market |
0.94 |
0.91 |
1.01 |
0.90 |
0.90 |
0.96 |
0.97 |
1.06 |
0.96 |
0.88 |
1.01 |
Factor Contribution |
0.75% |
1.22% |
-0.11% |
1.61% |
1.40% |
0.75% |
0.56% |
-1.14% |
0.63% |
2.04% |
2.06% |
Factor Intensity |
0.65 |
0.34 |
0.54 |
0.20 |
0.31 |
0.50 |
0.52 |
0.37 |
0.43 |
0.63 |
0.63 |
Factor Deconcentration |
3.84 |
2.24 |
4.65 |
2.00 |
2.59 |
3.96 |
4.35 |
1.96 |
3.20 |
5.14 |
5.11 |
Factor Exposure Quality |
2.48 |
0.77 |
2.50 |
0.40 |
0.81 |
1.98 |
2.24 |
0.72 |
1.49 |
3.24 |
3.22 |
* Macro conditionality analysis is with respect to seven macroeconomic variables: Short Rate, Term Spread, Default Spread, Dividend Yield, Effective Spread, Price Impact, Systematic Volatility. The methodology for selecting relevant macroeconomic variables is described in the Journal of Portfolio Management paper by Amenc et al. (2019) ‘"Macroeconomic Risks in Equity Factor Investing"’. The period for the Macro conditionality analysis is Jun-1970 to Dec-2018. Conditional ratios depicted are the average across the seven macroeconomic variables.
3. Conclusion
In this article, we have assessed the robustness of a set of competitor and Scientific Beta indices both from an index design point of view and with the lens of our robustness measurement protocol.
We have seen that competitor multi-factor strategies remain at a deficit compared to the stronger factor intensity and factor exposure quality of Scientific Beta indices thanks to the use of the High-Factor-Intensity filter mainly, and the avoidance of factor scores as a metric to define factor exposure. Indeed, the standardisation carried out on the basis of ranks or scores, which are traditionally used by our competitors to conduct stock selections on the basis of factor proxy definitions, ignores factor heterogeneity and variability. This can lead some alleged competitor multi-factor strategies to be poorly diversified across factors with low factor intensity and therefore weak factor exposure quality. The latter explains the lesser risk-adjusted outperformance potential of competitor strategies over the long-term. Of course, over the short-term, luck can help a multi-factor strategy with a weak factor exposure quality, if not exposed to the specific factor that underperforms. However, over the long-term, this type of non-explicit bet makes the strategy subject to a lack of robustness. Scientific Beta indices not only have strong factor intensity but also very good factor deconcentration, which makes them less sensitive to the underperformance of one specific factor and allows them to benefit from a higher potential of outperformance over the long-term.
We believe that it is essential that smart beta strategy performance reporting is accompanied by measurement of relative and absolute robustness of its performance. We have developed a framework to assess robustness according to five different dimensions and provide a comprehensive overview of a strategy's performance. Results allow us to assess whether the uncovered risks are acceptable given the objectives of the strategy or not. We have observed a lack of robustness across competitor strategies manifested in various forms. The Sharpe ratio test for statistically significant differences fail for most competitor strategies indicating no difference with the benchmark they aim to outperform. Conditionality to different market and economic states remains high, and as such any outperformance observed in one sample is not expected to repeat itself unless the same conditions prevail in the out-of-sample period and the long-term.
Overall, we believe that our robustness protocol allows for risks that would have otherwise remained hidden to be made explicit through this reporting. The better understanding of a strategy's performance in different environments allows investors to make investment choices that are well aligned with their objectives.
Footnotes:
1Examples for such strategies cited by Novy-Marx are the MSCI Quality Index which draws on a composite of three variables, and Research Affiliate’s Fundamental Indices which rely on composite measures of fundamental firm size.
2Size, Value, Momentum, Low Volatility, High Profitability and Low Investment are the six factors that carry a long-term premium as compensation for risk, as documented in the academic literature and explained with both a risk-based and behavioural-based economic rationale.
3Not enough data is available for the AQR Large Cap Multi-Style Fund and thus it is not included in the numerical analysis of the robustness protocol.
4For more information on the HFI filter, please refer to "Overview: The Benefits of the High Factor Intensity Filter," March 2020.
![]()
Assessing the Robustness of Smart Beta Strategies, Scientific Beta white paper, February 2020
Inconsistent Factor Indices: What are the Risks of Index Changes?, Scientific Beta white paper, February 2019
The Risks of Deviating from Academically-Validated Factors, Scientific Beta white paper, February 2019
The Benefits of the High Factor Intensity Filter
We provide an overview of Scientific Beta's High-Factor-Intensity filter that provides an elegant solution to the problem of factor interactions in a "top-down" framework and enables Scientific Beta indices to benefit from stronger factor intensity and factor exposure quality compared to competitors.
Introduction
Scientific Beta indices enable investors to control for cross-sectional factor interaction effects in the stock selection process. Indeed, every stock has different levels of exposure to each rewarded factor. For example, a stock with a high book-to-market ratio may have experienced negative momentum and, while including this stock in the portfolio would increase a desirable value tilt, it would decrease a desirable positive momentum tilt. Most commercial providers deal with this problem of factor interactions by chasing multi-factor champions through the so-called "bottom-up" approaches (i.e. selecting a subset of stocks with high composite multi-factor scores).
Research by Scientific Beta (see Amenc et al., 20171) compares the score-weighted "bottom-up" approach to multi-factor investing with the "top-down" approach based on smart factor indices. We conclude that typical "bottom-up" approaches achieve higher factor exposure, as one would expect, but bring in severe implementation challenges and higher levels of unrewarded risk due to concentration. The "top-down" approach utilising smart factor indices on the other hand provides better performance per unit of factor exposure by preserving diversification benefits and avoiding an over-exploitation of noisy security-level information in the formation of portfolios.
With the use of the High-Factor-Intensity (HFI) filter, Scientific Beta provides an elegant solution to the problem of factor interactions in a "top-down" framework. By relying on the exclusion of stocks with poor multi-factor scores from single-factor selections, they preserve the flexibility, transparency and efficiency of "top-down" multi-factor portfolio construction based on smart factor indices. From the point of view of risk and performance, excluding such "factor losers" may also produce more benefits than focusing on "factor champions" as is favoured by "bottom-up" approaches.
Top Down vs Bottom Up
As shown in Exhibit 1, the absolute value of underperformance for the factor loser portfolios is greater than the outperformance of the factor champion portfolios. For example, the relative return of the portfolio with the top 5% stocks selected based on geometric mean multi-factor score is 4.2%, whereas the relative return of the corresponding portfolio with the 5% loser multi-factor stocks is -7.6%. Hence the elimination of stocks with poor multi-factor scores from long-only portfolios may prove more powerful than the concentration in "factor champions".
Exhibit 1: Factor Champions vs Losers Comparison
EDHEC-Risk US Long-Term Track Record (45 years) |
Geometric Mean |
Arithmetic Mean |
||
Champions
|
Losers |
Champions
|
Losers |
|
5% Selection
|
||||
Annualised Relative Return |
4.2% |
-7.6% |
3.8% |
-7.1% |
Factor Intensity |
1.17 |
-1.81 |
1.17 |
-1.75 |
Based on daily total returns in USD from 31-Dec-1974 to 31-Dec-2019. The EDHEC Risk US LTTR cap-weighted index is used as the benchmark. The 3-month US Treasury bill rate is used as the proxy for the risk-free rate. Champion portfolios are the top 5% stocks selected based on a multi-factor score that is either the geometric mean of the six individual factors scores or the arithmetic mean of the six individual factor scores and weighted based on multiplication of their cap-weight and multi-factor score. Loser portfolios are the bottom 5% stocks selected based on a multi-factor score that is either the geometric mean of the six individual factors scores or the arithmetic mean of the six individual factor scores and weighted based on multiplication of their cap-weight and the inverse of the multi-factor score. The individual factor scores of each stock are the rank scores of the stocks towards the corresponding factor variable.
It is for this reason that Scientific Beta's High-Factor-Intensity filter focuses on eliminating stocks with the lowest multi-factor scores. The HFI filter is applied on the set of retained stocks resulting from the primary stock selection (50%) and is applied within each Mega-Sector in order to ensure a good mega-sector diversity as described in Figure 1 below. The resulting stock selection is therefore reduced from 50% to 30% of the size of the universe.
Figure 1: High-Factor-Intensity Filtered Smart Factor Indices
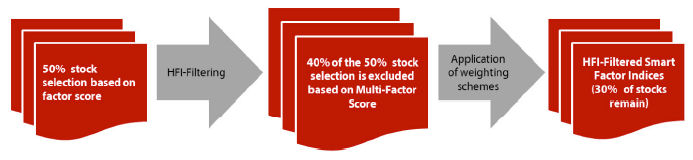
The HFI filter uses a multi-factor score (MFS) based on a stock's normalised ranks with respect to five rewarded factor tilts (Value, Positive Momentum, Low Volatility, High Profitability and Low Investment). The Mid-Cap score is not taken into account because diversified indices have a natural mid-cap bias that is not diluted by the blending of indices representative of different factors2. The multi-factor score is a weighted average of individual scores, which allows the distribution of factor intensity of each individual factor to be captured. Indeed, factor intensities are not distributed equally between factors and vary over time as seen in Figure 2, which could lead to strong evolutions in the exposures to each factor for multi-factor constructions. The adjustment of the MFS filter, according to the distance between the intensity of the 30% top/bottom factor score divided by the average factor score of the universe, allows these intensity distortions to be corrected and ultimately provides multi-beta indices with more balanced and stable factor exposures.
Figure 2: Factor Score Time-Varying Distribution
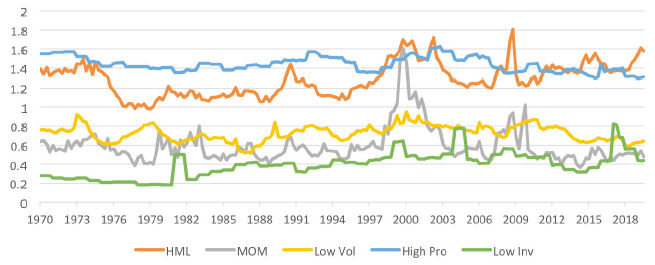
Stronger Factor Intensity
Exhibit 2 displays the long-term average factor exposures of the six strategic tilts used in the long-only multi-factor solutions offered by Scientific Beta. We underscore that the use of the HFI filter ensures a much stronger factor intensity, the sum of non-market factor exposures, as well as a higher factor deconcentration, which measures how well exposures are balanced across factors. Factor deconcentration measures the diversification of factor exposures of a portfolio. It is computed as the inverse of the sum of squared relative betas. If factor exposures are perfectly diversified, i.e. the same exposures to all risk factors, then the ratio is equal to six. Moreover, it provides a stronger Factor Exposure Quality, which is the product of factor intensity and factor deconcentration, since the increase of factor intensity is accompanied by more balanced factor exposures. This means that indices using the HFI filter are more robust when faced with the underperformance of a specific factor and will capture a higher proportion of factor long-term rewards. Finally, the stability of factor exposures is improved thanks to the weighted average multi-factor score that captures time-varying distribution of factor score intensity.
Exhibit 2: Impact of the HFI Filter on Factor Exposues
EDHEC-Risk US Long-Term Track Record (45 years) |
Average of Six Factor Indices Tilted Towards Mid-Cap, Value, High Momentum, Low Volatility, High Profitability and Low Investment Stocks |
|
Standard 50% Cap-Weighted |
High Factor Intensity Diversified Multi-Strategy |
|
Ann. Unexplained |
-0.02% |
-0.01% |
Market Beta |
0.97 |
0.86 |
SMB Beta |
0.03 |
0.10 |
HML Beta |
0.04 |
0.13 |
MOM Beta |
0.04 |
0.06 |
Low Vol Beta |
0.00 |
0.10 |
High Prof Beta |
0.01 |
0.10 |
Low Inv Beta |
0.05 |
0.10 |
Factor Intensity (Int) |
0.18 |
0.59 |
Factor Deconcentratio (ENF) |
4.35 |
5.77 |
Factor Exposure Quality (Int x ENF) |
0.80 |
3.39 |
Factor Betas Stabiility |
14.57 |
15.73 |
Based on daily total returns in USD from 31-Dec-1974 to 31-Dec-2019. The EDHEC Risk US LTTR cap-weighted index is used as the benchmark. The three-month US Treasury bill rate is used as the proxy for the risk-free rate. Factor exposures are based on a seven-factor model. The Market factor is the excess return series of the cap-weighted index of all stocks that constitute the index portfolio over the risk-free rate. SMB factor is the return series of an equal-weighted portfolio that is long small-cap stocks and short for the top 30% stocks ranked by market capitalisation (large market-cap stocks). HML factor is the return series of an equal-weighted portfolio that is long for the top 30% stocks (value stocks) and short for the bottom 30% stocks (growth stocks) sorted on book-to-market value in descending order. The MOM factor is the return series of an equal-weighted portfolio that is long the winner stocks and short the loser stocks. The winner stocks (inversely the loser stocks) are defined as the top 30% (inversely the bottom 30%) of stocks, sorted on the past 52 weeks’ compounded returns excluding the most recent month, in descending order. The Low Vol factor is the return series of an equal-weighted portfolio that is long the bottom 30% stocks (low volatility stocks) and short the top 30% stocks (high volatility stocks) sorted on past volatility in descending order. The High Profitability factor is the return series of an equal-weighted portfolio that is long the top 30% stocks (high profitability stocks) and short the bottom 30% stocks (low profitability stocks) sorted on gross profitability in descending order. The Low Investment factor is the return series of an equal-weighted portfolio that is long the bottom 30% stocks (low investment stocks) and short the top 30% stocks (high investment stocks) sorted on two-year asset growth in descending order. The factors are market beta neutralised ex-post on a quarterly basis. Factor intensity (Int) is the sum of non-market beta exposures. Factor deconcentration (ENF) is the inverse of the sum of squared relative betas. Relative betas are each individual non-market factor beta divided by factor intensity. Factor Exposure Quality (Int x ENF) is the factor intensity multiplied by factor deconcentration. The factor beta stability is the sum of the absolute mean of 10-year rolling factor exposures divided by the 10-Year rolling standard deviation of betas. The higher the measure, the higher the stability is Factor exposures in bold are statistically significant
at a 5% level.
Well-Balanced Exposures are the Key to Robustness
In the tables of Exhibit 3a and 3b, we compare factor exposure metrics of the HFI Diversified Multi-Beta Multi-Strategy 6-Factor 4-Strategy EW index (SciBeta US HFI MBMS 6F 4S EW) and competitors' multi-factor strategies on the US region over the last five and 10 years. We emphasise that our index, which benefits from the HFI filter, delivers much stronger factor intensity, factor deconcentration and factor exposure quality. The factor intensity of our multi-factor index is 53% higher over the last five years (44% over the last 10) than competitors that do not take account, for most of them, cross-factor interactions because they rely on scores and bottom-up construction approaches. Moreover, its factor deconcentration and factor exposure quality are 50% and 120% higher compared to the average of competitors respectively over the last five years (57% and 109% over the last 10).
Exhibit 3a: Competitor Factor Exposure Analysis Over the Last Five Years
SciBeta US |
Factor Intensity |
Factor Deconcentration |
Factor Exposure Quality |
Factor Performance Contribution |
SciBeta US HFI MBMS 6F 4S EW |
0.73 |
5.14 |
3.76 |
1.81% |
Average of Competitors |
0.48 |
3.42 |
1.71 |
0.47% |
Russell 1000 Comprehensive Factor |
0.76 |
4.22 |
3.19 |
1.11% |
JPMorgan Div. Factor US Equity |
0.44 |
3.00 |
1.32 |
1.25% |
MSCI USA Div. Multi-Factor |
0.57 |
4.03 |
2.28 |
-0.87% |
MSCI USA Factor Mix |
0.22 |
2.70 |
0.60 |
1.69% |
S&P GIVI US |
0.35 |
2.97 |
1.05 |
1.21% |
RAFI Multi-Factor US |
0.55 |
3.70 |
2.03 |
0.76% |
RAFI Dynamic Multi-Factor US |
0.58 |
4.40 |
2.54 |
0.76% |
DFA US Core Equity |
0.41 |
2.64 |
1.09 |
-1.17% |
Robeco US Multi-Factor Equities |
0.47 |
3.80 |
1.79 |
0.84% |
AQR Large Cap Multi-Style Fund |
0.42 |
2.74 |
1.16 |
-0.88% |
The analysis is conducted from 31/12/2014 to 31/12/2019 on USD total returns. The Scientific Beta United States cap-weighted index is used as the cap-weighted reference. The regressions are based on weekly total returns. Factors are defined as in Exhibit 2. The factors are market beta neutralised ex-post on a quarterly basis. Factor intensity is the sum of non-market beta exposures. Factor deconcentration is the inverse of the sum of squared relative betas. Relative betas are each individual non-market factor beta divided by factor intensity. Factor Exposure Quality is the factor intensity multiplied by factor deconcentration. Factor Performance Contribution is the sum of factor contribution of each non-market factor over the period.
We underline that some competitors' strategies are concentrated with less than three effective factors, which is low for multi-factor solutions, knowing that there are six well-known rewarded risk factors that are academically validated. A strategy with well-balanced exposures across the six factors is key to the robustness of its outperformance, since it avoids the latter becoming too dependent on the underperformance of a specific factor. This can be directly observed by looking at the contribution of factors to the performance of the strategy. We emphasise that the factor performance contribution, which is a direct consequence of the strong factor exposure quality of our multi-factor index over the period, is equal to 1.81% over the last five years (2.12% over the last 10), whereas the average measure for competitors is only 0.47% (0.78%), with some of them having negative factor contributions.
Exhibit 3b: Competitor Factor Exposure Analysis Over the Last Ten Years
SciBeta US |
Factor Intensity |
Factor Deconcentration |
Factor Exposure Quality |
Factor Performance Contribution |
SciBeta US HFI MBMS 6F 4S EW |
0.63 |
5.16 |
3.25 |
2.12% |
Average of Competitors |
0.44 |
3.30 |
1.56 |
0.78% |
Russell 1000 Comprehensive Factor |
0.65 |
3.88 |
2.50 |
0.80% |
JPMorgan Div. Factor US Equity |
0.34 |
2.25 |
0.76 |
1.29% |
MSCI USA Div. Multi-Factor |
0.53 |
4.67 |
2.49 |
-0.10% |
MSCI USA Factor Mix |
0.20 |
2.01 |
0.40 |
1.67% |
S&P GIVI US |
0.31 |
2.58 |
0.80 |
1.47% |
RAFI Multi-Factor US |
0.50 |
3.95 |
1.98 |
0.79% |
RAFI Dynamic Multi-Factor US |
0.52 |
4.37 |
2.27 |
0.58% |
DFA US Core Equity |
0.36 |
1.94 |
0.71 |
-1.15% |
Robeco US Multi-Factor Equities |
0.52 |
4.03 |
2.11 |
1.64% |
The analysis is conducted from 31/12/2009 to 31/12/2019 on USD total returns. The Scientific Beta US cap-weighted index is used as the cap-weighted reference. The regressions are based on weekly total returns. Factors are defined as in Exhibit 2. The factors are market beta neutralised ex-post on a quarterly basis. Factor intensity is the sum of non-market beta exposures. Factor deconcentration is the inverse of the sum of squared relative betas. Relative betas are each individual non-market factor beta divided by factor intensity. Factor Exposure Quality is the factor intensity multiplied by factor deconcentration. Factor Performance Contribution is the sum of factor contribution of each non-market factor over the period. We have no data on AQR Large Cap Multi-Style Fund over this period.
Conclusion
The stronger factor intensity and factor exposure quality of Scientific Beta indices compared to competitors are explained by the use of the High-Factor-Intensity filter. Indeed, the standardisation carried out on the basis of ranks or scores, which are traditionally used by our competitors to conduct stock selections on the basis of factor proxy definitions, ignores factor heterogeneity and variability. This can lead some alleged competitor multi-factor strategies to be poorly diversified across factors with low factor intensity and therefore weak factor exposure quality. The latter explains the lesser risk-adjusted outperformance potential of competitor strategies over the long term. Of course, over the short term, luck can help a multi-factor strategy with a weak factor exposure quality, if not exposed to the specific factor that underperforms. However, over the long term, this type of non-explicit bet makes the strategy subject to a lack of robustness. Scientific Beta indices not only have strong factor intensity but also very good factor deconcentration, which makes them less sensitive to the underperformance of one specific factor and allows them to benefit from a higher potential of outperformance over the long term.
Footnotes:
1Amenc, N., F. Ducoulombier, M. Esakia, F. Goltz and S. Sivasubramanian. 2017. Accounting for Cross-Factor Interactions in Multifactor Portfolios without Sacrificing Diversification and Risk Control. Journal of Portfolio Management 43(5): 99-114.
2Note that for our long/short indices, we use an anti-HFI filter to filter out stocks in the short branch that takes into account the Mid-Cap score to reduce the size bias.
![]()
The Benefits of the High Factor Intensity Filter, Scientific Beta publication, February 2020
Appraising the Draft Delegated Acts on Climate Benchmarks and ESG Disclosures
Scientific Beta has reviewed the proposals of the Technical Expert Group that advised the European Commission and finds that they do not respect the spirit of the European Benchmark Regulation. We have made three series of remedial recommendations that involve promoting high decarbonisation across all index strategies, adopting metrics that recognise the decarbonisation efforts of corporates and investors, and avoiding misleading or irrelevant ESG disclosures and keeping ESG data costs in check.
The 2019 update of the European Benchmark Regulation (Regulation (EU) 2019/2089) creates labels for Benchmarks that are on a decarbonisation trajectory or are aligned with the Paris Agreement under the United Nations Framework Convention on Climate Change (hereafter "Climate Benchmarks"). The Regulation also introduces a requirement for the Benchmark methodology and statement to include explanations of how Environmental, Social and Governance (hereafter "ESG") dimensions are reflected when a Benchmark pursues ESG objectives. The EU Climate Transition and EU Paris-aligned Benchmarks labels aim to harmonise and improve transparency of the climate change index market at the EU level and to ensure a high level of investor protection by combatting misleading claims as to the environmental credentials of investments, or greenwashing. The introduction of disclosure requirements with respect to ESG incorporation into Benchmarks ambitions to facilitate cross-border comparisons and help market participants make well-informed choices.
In this context, the legislator has empowered the European Commission to adopt delegated acts both to specify minimum standards in terms of asset selection and weighting and the determination of the decarbonisation trajectory and to lay out the minimum contents of explanations about ESG incorporation and their standard format.
On April 8, the European Commission released three draft delegated acts pertaining to the minimum standards of the Climate Transition and Paris-aligned Benchmark labels (hereafter "Climate Benchmarks") created by the November 2019 update (Regulation 2019/2089) of the European Benchmark Regulation and laying out ESG disclosure requirements for all indices used as Benchmarks in the European Union.
In the preparation of these acts, the European Commission sought the advice of the Technical Expert Group on Sustainable Finance ("TEG"). Scientific Beta engaged the TEG ahead of the publication of its final report and conducted a critical, in-depth, analysis of the TEG proposals. Scientific Beta's criticisms and remedial recommendations were shared with the European Commission and publicly detailed in the February 2020 White Paper titled "Unsustainable Proposals".
While the draft delegated acts have streamlined the TEG proposals and corrected some of their mistakes and incoherencies, these improvements are peripheral and the European Commission has endorsed the core orientations of the TEG.
Scientific Beta has three main issues with the proposed delegated acts:
Introduction of expansive and expensive ESG disclosures in Benchmark Statements – the proposals do not respect the spirit of the Regulation and are ultra vires
The purpose of the Benchmark statement, as described in the Benchmark Regulation (Recital 43 of Regulation 2016/1011), is to provide (would-be) users with a description of what the index used as Benchmark measures and how susceptible it is to manipulation. As provided by the Regulation, Benchmark statements should be of reasonable length and focus on providing the key information. The minimum disclosures in the Benchmark statement are strictly concerned with how a benchmark is constructed and managed; Benchmark performance – financial or otherwise – is not part of minimum disclosures. The updated Benchmark Regulation provides that "the benchmark statement shall contain an explanation of how ESG factors are reflected".
Instead of specifying how explanations on the incorporation of ESG dimensions should be provided, the draft delegated act pertaining to the benchmark statement establishes a long list of ESG indicators to be computed and disclosed. If implemented, these disclosures would modify the nature of the Benchmark statement and entail considerable administrative and data acquisition costs for Benchmark administrators. As such, they would become an essential dimension of the Regulation, which would be inconsistent with the scope of the legislative delegation enjoyed by the European Commission. We thus contend that the TEG proposals are ultra vires.
Table 1 below details the disclosures that would be required of all benchmarks pursuing ESG objectives; additional disclosures apply to Climate Benchmarks.
Table 1: ESG Disclosures in the Benchmark Statement (would apply to all benchmarks pursuing ESG objectives)
ESG Themes |
Draft Delegated Act Disclosures |
Overall ESG
|
Weighted average ESG rating of the benchmark (voluntary) |
Overall ESG ratings of top ten index constituents by weighting in index |
|
Total weighting of index constituents not meeting the principles of the UN Global Compact (conduct-related controversy screen) |
|
Environmental
|
Weighted average environmental rating of the benchmark (voluntary) |
Exposure to sectors highly exposed to climate change issues |
|
Carbon intensity |
|
Reported vs estimated emissions (%) |
|
Exposure to energy and mining plus manufacture of coke, refined petroleum products, chemicals and chemical products (added by Commission) |
|
Exposure to environmental goods and services sector (added by Commission) |
|
Exposure to renewable energy as measured by Capex relative to total CapEx of energy companies in portfolio (added by Commission) |
|
Exposure to climate-related physical risks (extreme weather events) on companies’ operations/production or on supply chain |
|
Social
|
Weighted average social rating of the benchmark (voluntary) |
"Weighted average percentage" (sic) of index constituents in the controversial weapons "sector" (sic) |
|
"Weighted average percentage" of index constituents in the tobacco sector |
|
Controversial weapons definition |
|
(Absolute and Relative) Number of constituents subject to social violations "in reference to treaties and conventions, UN principles and national law." |
|
Governance
|
Weighted average governance rating of the benchmark (voluntary) |
Weighted average percentage of board members who are independent. |
|
Weighted average percentage of female board members |
The TEG proposals are unduly influenced by commercial interests and champion the interests of ESG data and services providers rather than sustainability
The composition of the working group that prepared the proposals endorsed by the European Commission is marked by under-representation of the potential end-users of Benchmarks, which the Regulation aims to protect, and is skewed towards providers of ESG data and services, i.e. parties that stand to benefit from the proposals. As discussed in our White Paper, Climate Benchmark anchoring on capitalisation-weighted indices, the adoption of an exotic metric for the assessment of decarbonisation and, most of all the introduction of extensive and onerous ESG disclosures of dubious relevance may be viewed as illustrations of a dismal failure of conflict-of-interest management on the part of the TEG and, by extension, of the European Commission.
As per the spirit and the letter of the updated Regulation, benchmarks that do not pursue ESG objectives need only state as much to be exempted from the proposed reporting. This made complete sense in the context of a qualitative explanation of ESG incorporation. However, by making ESG disclosures especially onerous, the European Commission discourages the incorporation of ESG dimensions into Benchmarks, creates a unique competitive disadvantage for Climate Benchmarks and other Benchmarks that pursue ESG objectives, and de-incentivises the voluntary adoption of these disclosures.
The proposals are flawed, do little to discourage greenwashing in the financial industry or support decarbonisation efforts in the real economy, and fail to promote better decision-making around sustainability
Reviewing the draft delegated acts in detail, we find three severe flaws.
Decarbonisation relative to capitalisation-weighted indices reduces scope of Regulation and primitive sector control fails to protect against greenwashing
The draft delegated act specifying the minimum requirements for EU Climate Benchmarks imposes a decarbonisation relative to the broad-market index (of 30% for Climate Transition Benchmarks and 50% for Paris-aligned Benchmarks).
Table 2: Minimum Standards for EU Climate Benchmarks (as per Draft Delegated Act)
Minimum Standards |
Climate Transition |
Paris-aligned |
Minimum Carbon Intensity Reduction Compared to Investable Universe |
30% (Art. 9) | 50% (Art. 10) |
Scope 3 Phase-in |
• Immediate for energy and mining plus manufacture of coke, refined petroleum products, chemicals and chemical products • Two years for transportation, construction, buildings, materials, industrial activities • Four years for all other activities |
|
Baseline Exclusions |
None |
• Controversial Weapons • Tobacco • Violators UNGC Principles or OECD MNE • Companies doing significant harm to environmental objectives of future taxonomy Regulation |
Activity Exclusions
|
None |
• Coal involvement - supply (1%+ revenues) • Oil involvement - supply (10%+) • Natural Gas involvement (50%+) • Electricity Generation with GHG intensity above 100gCO2/kWh (50%+) |
Year-on-Year Self-Decarbonisation of the Benchmark |
7% fall in Carbon Intensity for Listed Equity on geometric average per annum (Art. 7.1(a); 7.2; 8), with inflation adjustment (Art. 7.3) to compensate for yearly increases in average Enterprise Value Including Cash in the universe (no adjustment for decreases) |
|
Exposure Constraints |
Exposure to sectors highly exposed to climate change issues is at least equal to that of market benchmark (Art. 3) |
|
Corporate Target Setting |
Companies that set and publish GHG emission reduction targets may be overweighed subject to conditions to prevent greenwashing (Art. 6) | |
Given the diversity of investor needs and strategies, anchoring Climate Benchmarks on broad-market benchmarks reduces the scope of the Regulation and thus its ability to combat greenwashing and promote the reorientation of capital flows towards a more sustainable economy.
In addition, the act sets sector exposure constraints as a crude method to protect against greenwashing. Such an approach at best gives a false sense of security in regards to greenwashing and at worst, encourages it.
The exotic carbon exposure measure proposed is a wasteful distraction from existing standards and is not fit for purpose
Misleadingly called Carbon Intensity, the main metric put forward by the delegated acts for assessing the carbon friendliness of Benchmarks is a variation on Weighted Average Carbon Intensity (WACI), the popular carbon exposure metric recommended for reporting by the Task Force on Climate-related Financial Disclosures (TCFD).
While the standard version of WACI relies on revenues to normalise corporate emissions of greenhouse gases, the European Commission adopts Enterprise Value.1 This deviation from the generally accepted carbon exposure metric is not supported by a literature review or a cost/benefit analysis.
WACI being a relative measure, the delegated act requires that it be reduced year after year and adjusted for inflation in Enterprise Value to put the EU Climate Benchmarks on a decarbonisation path (a value of 7% is adopted for consistence with the Paris agreement).
However, the consequences of Enterprise Value volatility on the decarbonisation trajectory have not been thought through. As an illustration, between January and March, the intensity of provisional EU-aligned Climate Benchmark products administered by a global provider rose by almost 25% due to fluctuations in Enterprise Value.2
Last but not least, the draft delegated act requires the inclusion of indirect emissions through the value chain (Scope 3 emissions) for the computation of Carbon Intensity. In most sectors (power generation and basic materials being exceptions), Scope 3 emissions dwarf those from sources owned or controlled by the reporting company (Scope 1) and those pertaining to purchases of electricity, heating and cooling (Scope 2). The proper consideration of value-chain emissions is important but, unfortunately and by the very admission of the TEG, Scope 3 data will not be fit for purpose of stock selection "for the foreseeable future". It follows that including Scope 3 emissions into index construction may lead to disregarding the efforts made by companies in the mitigation of their greenhouse gas emissions (which at this stage are partially but reasonably reliably captured by Scope 1 and 2 emissions). This would be a pathetic travesty of the design of the Regulation.
The proposed ESG disclosures have limited informational value
The third severe flaw is the dramatic failure of the proposals to enhance transparency and enable market participants to make well-informed choices in respect of the incorporation of ESG factors into Benchmarks. Indeed, the onerous ESG disclosures contained in the draft delegated act have mixed informational value. This is primarily due to them giving a large share to metrics – ESG ratings – whose inherent divergence frustrates the possibility of meaningful comparisons across providers3 and that have serious theoretical limitations as indicators of ESG performance or risks. In the latter respect, it is a progress that the draft delegated act parted with the TEG in failing to make the reporting of portfolio-wide averages of ESG indicators a requirement. However, the draft delegated act still requires the reporting of the ESG ratings of top ten index constituents (irrespective of index concentration). It is to be noted that, relative to the TEG proposals, the European Commission has increased the share of indicators that are specific enough to allow for comparisons across indices. However, the majority of indicators to be reported lack the necessary standardisation to support meaningful uses by investors.
Proposed corrections and improvements
Against this backdrop, we make three series of remedial recommendations:
Promoting high decarbonisation across all index strategies
To avoid narrowing the scope of the Regulation, we recommend that Climate Benchmarks retain full flexibility in respect of sector exposures while being required to achieve a high level of decarbonisation in a manner that controls for any sector effects (and show how this can be done in the manner of the WACI decomposition that is part of our complimentary ESG reporting). We also recommend that the respect of the decarbonisation target of an index strategy be assessed in relation to its non-decarbonised version rather than the market benchmark.
Adopting metrics that recognise the decarbonisation efforts of corporates and investors
To respect the investments already made by concerned parties in the education of the public and the decarbonisation of Benchmarks and to incentivise companies to decarbonise their operations, we strongly recommend that decarbonisation be primarily assessed using the generally accepted carbon exposure metric that the TCFD has recommended for reporting. The reduction of indirect emissions through the value chain (Scope 3 emissions) should be promoted separately in a manner that is consistent with the current granularity and other limitations of available data.
Avoiding misleading or irrelevant ESG disclosures and keeping ESG data costs under check
To avoid de-incentivising the offering and adoption of Benchmarks that pursue ESG objectives and to promote well-informed decision-making in matters of sustainability, we recommend that, as per the letter of the Regulation, ESG disclosures remain focused on explaining how ESG dimensions are incorporated into indices used as Benchmarks.
It is critical that ESG ratings not be given regulatory endorsement and that they remain excluded from minimum disclosures.
To be informative, disclosures in respect of ESG factors beyond what is strictly required under the Regulation should be focused on exposure to desirable or controversial activities, precisely defined and highly standardised. The informational value of additional ESG disclosures should be sufficient to compensate for the administrative and data acquisition and redistribution costs that they entail and which will ultimately be borne by investors.
To increase the informational value of disclosures and keep cost inflation in check, we recommend that an administrative body be tasked with maintaining a public list of compliant and non-compliant issuers. In this regard, European regulators could Go North and take inspiration from the remarkable work done by the Council on Ethics for Norway’s Government Pension Fund Global (or within the Union, the Council on Ethics of the Swedish National Pension Funds).
For details of our analyses, criticisms and proposals, refer to: "Unsustainable Proposals: A critical appraisal of the TEG Final Report on climate benchmarks and benchmarks' ESG disclosures and remedial proposals".
A call for action
It is still possible for the European Commission to correct the serious design flaws in the three delegated acts on Climate Benchmarks and ESG disclosures.
The ongoing consultations on these delegated acts are an opportunity for investors to make their voices heard and we invite our clients and all stakeholders to share their concerns and proposals with the Commission before 6 May.
Consultation on Climate Benchmark requirements:
https://ec.europa.eu/info/law/better-regulation/have-your-say/initiatives/12020-Minimum-standards-for-benchmarks-labelled-as-EU-Climate-Transition-and-EU-Paris-aligned-Benchmarks
Consultation on incorporation of ESG factors into benchmark statement:
https://ec.europa.eu/info/law/better-regulation/have-your-say/initiatives/12019-References-to-ESG-factors-enabling-market-participants-to-make-well-informed-choices
Consultation on incorporation of ESG factors into methodology:
https://ec.europa.eu/info/law/better-regulation/have-your-say/initiatives/12018-Key-elements-of-the-methodology-reflecting-environmental-social-or-governance-ESG-factors
Footnotes:
1It appears the Commission has taken into account stakeholder feedback by including Cash into its definition of Enterprise Value where the TEG had simply adopted the version used by Mergers and Acquisitions specialists, which excludes it. Thus, our criticisms of the biases and operational issues created by the omission of cash in Enterprise Value do not apply to the draft delegated act.
2EU Climate Benchmarks: The row over carbon intensity metrics explained, Khalid Azizuddin, Responsible Investor, 23 April 2020.
3On this topic, see for example Aggregate Confusion: The Divergence of ESG Ratings, Berg, Kölbel and Rigobon, MIT Sloan Research Paper No. 5822-19, 2019.
![]()
Unsustainable Proposals: A critical appraisal of the TEG Final Report on climate benchmarks and benchmarks' ESG disclosures and remedial proposals, Scientific Beta white paper, February 2020
Partner News

News of the partnerships and licences established with industry participants to replicate Scientific Beta indices.
Scientific Beta has forged partnerships with asset managers who not only replicate its indices but also propose open funds enabling investors to readily invest in the strategies proposed by Scientific Beta that they have selected. In this issue, we focus on Global X.
Global X
In March, 2020, Global X, the New York-based provider of exchange-traded funds founded in 2008, announced a major investment by Tokyo-based Daiwa Securities Group Inc., structured as a $120m convertible bond which Daiwa can choose to convert to a minority equity stake in Global X in five years. This move contributes to a further alignment of the two companies after announcing in September 2019 the creation of Global X Japan, a joint venture to deliver intelligent investment solutions to Japanese investors.
Global X has a number of historical ETFs based on Scientific Beta multi-factor indices that are listed on the New York Stock Exchange:
• The Global X Scientific Beta US ETF (Bloomberg ticker: SCIU) which replicates the Scientific Beta United States Multi-Beta Multi-Strategy Four-Factor ERC Index (Bloomberg ticker: SBUXRHMG)
• The Global X Scientific Beta Japan ETF (Bloomberg ticker: SCIJ) which replicates the Scientific Beta Japan Multi-Beta Multi-Strategy Four-Factor ERC Index (Bloomberg ticker: SBJURHMN)
• The Global X Scientific Beta Europe ETF (Bloomberg ticker: SCID) which replicates the Scientific Beta Extended Developed Europe Multi-Beta Multi-Strategy Four-Factor ERC Index (Bloomberg ticker: SBRXRHMN)
• The Global X Scientific Beta Asia ex-Japan ETF (Bloomberg ticker: SCIX) which replicates the Scientific Beta Developed Asia-Pacific ex-Japan Multi-Beta Multi-Strategy Four-Factor ERC Index (Bloomberg ticker: SBAXRHMN)
The Scientific Beta Multi-Beta Multi Strategy Four-Factor ERC Indices are characterised by the equalisation of the contribution to the tracking error (ERC) of each smart factor among the most popular choices of factor considered to be well-rewarded in the financial literature (Value, Size, Momentum and Low Volatility). These indices benefit from a double diversification – allocation across different factors (multi-beta allocation) along with diversification of the specific risks of each smart factor index (diversified multi-strategy weighting scheme).

Scientific Beta Smart Factor Indices Performance
Scientific Beta offers smart factor indices that provide exposure to the six well known rewarded factors (Mid-Cap, Value, High Momentum, Low Volatility, High Profitability, and Low Investment) and which are also well diversified in order to reduce the specific risks. These indices are available in a variety of versions, notably enabling broad and narrow indices to be distinguished that correspond to more or less pronounced choices of factor exposure. Many investors choose to diversify their factor exposure so as not to be exposed to variations in the performance of a single factor. For this reason, Scientific Beta Multi-Beta Multi-Strategy (MBMS) indices provide an allocation to well-rewarded smart factor indices.
Scientific Beta proposes a wide range of Multi-Beta Multi-Strategy indices based on the Smart Beta 2.0 investment philosophy. This report presents those indices that enable the diversification of factor and specific risks to be reconciled. Among these indices, we have chosen to present the Scientific Beta High-Factor-Intensity Diversified Multi-Beta Multi-Strategy 6-Factor 4-Strategy Equal-Weight index, which takes into account the interactions between single-factor indices in order to provide higher factor intensity at a multi-factor level, and its Sector Neutral and combined Sector Neutral/Market Beta Adjusted (Overlay) versions.
Performance Overview of Multi-Beta Multi-Strategy Indices in Q1 2020
The table below displays an overview of the relative and absolute performance in Q1 2020 of Scientific Beta Multi-Beta Multi-Strategy and competitors' strategies for the United States and Developed ex-US regions.
Exhibit 1: Q1 2020 Performance of Scientific Beta HFI MBMS 6F 4S EW Indices with Different Risk Control Options and the Average of Competitors
Q1 2020 |
Std |
SN |
MBA |
SN + MBA |
Avg. Competitors |
United States |
|||||
Cumulative Returns |
-23.38% |
-23.83% |
-26.75% |
-25.03% |
-23.96% |
| Ann. Volatility | 56.58% |
56.56% |
65.08% |
60.24% |
57.02% |
| Sharpe Ratio | n/r |
n/r |
n/r |
n/r |
n/r |
| Rel. Returns | -4.15% |
-4.60% |
-7.52% |
-5.80% |
-4.72% |
Ann. Tracking Error |
7.56% |
6.38% |
11.31% |
7.33% |
7.17% |
Information Ratio |
n/r |
n/r |
n/r |
n/r |
n/r |
Developed ex USA |
|||||
Cumulative Returns |
-24.38% |
-24.32% |
-26.42% |
-26.33% |
-24.25% |
| Ann. Volatility | 35.70% |
35.74% |
38.65% |
38.70% |
38.31% |
| Sharpe Ratio | n/r |
n/r |
n/r |
n/r |
n/r |
| Rel. Returns | -1.28% |
-1.21% |
-3.32% |
-3.22% |
-1.14% |
Ann. Tracking Error |
3.66% |
3.73% |
4.11% |
4.24% |
9.80% |
Information Ratio |
n/r |
n/r |
n/r |
n/r |
n/r |
The analysis is based on daily USD total returns from 31-Dec-2019 to 31-Mar-2020 in the SciBeta USA and SciBeta Developed ex-US universes. All statistics are annualised except for the cumulative returns and relative returns. Indices used for the US Panel are the SciBeta HFI Diversified MBMS 6F 4S EW or Std in the table, SciBeta HFI Diversified MBMS (Sector Neutral) 6F 4S EW (SN) or SN in the table, the SciBeta HFI Diversified MBMS 6F 4S EW MBA (Overlay) or MBA in the table and the SciBeta HFI Diversified MBMS (Sector Neutral) 6F 4S EW Market Beta Adjusted (Overlay) or SN + MBA in the table. Competitors' indices used are the MSCI USA Diversified Multi-Factor index, the MSCI USA Factor Mix, the JPMorgan Diversified Factor US, the S&P GIVI US, the RAFI USA Multi-Factor index, the RAFI Dynamic Multi-Factor US, the AQR USA Large Cap Multi-Style fund, the Russell 1000 Comprehensive Factor index and the DFA US Core Equity fund. Indices used for the Developed ex-US panel are the SciBeta HFI Diversified MBMS 6F 4S EW or Std in the table, SciBeta HFI Diversified MBMS (Sector Neutral) 6F 4S EW (SN) or SN in the table, the SciBeta HFI Diversified MBMS 6F 4S EW MBA (Overlay) or MBA in the table and the SciBeta HFI Diversified MBMS (Sector Neutral) 6F 4S EW Market Beta Adjusted (Overlay) or SN + MBA in the table. Competitors’ indices used are the FTSE Developed ex US Comprehensive Factor, the JP Morgan Diversified Factor International, the MSCI World ex USA Diversified Multi-Factor, the S&P GIVI Developed Ex-US, the RAFI Developed ex US Multi- Factor, the RAFI Developed ex US Dynamic Multi-Factor, the AQR International Multi-Style Fund and the DFA International Core Equity fund.
Absolute returns for Scientific Beta indices varied from -23.38% for the SciBeta United States High-Factor-Intensity Diversified Multi-Beta Multi-Strategy 6-Factor 4-Strategy EW index to -26.75% for the SciBeta United States High-Factor-Intensity Diversified Multi-Beta Multi-Strategy 6-Factor 4-Strategy EW Market Beta Adjusted (Overlay) index, while relative returns ranged from -1.21% for the SciBeta Developed ex USA High-Factor-Intensity Diversified Multi-Beta Multi-Strategy (Sector Neutral) 6-Factor 4-Strategy EW index to -7.52% for the SciBeta United States High-Factor-Intensity Diversified Multi-Beta Multi-Strategy 6-Factor 4-Strategy Market Beta Adjusted (Overlay) EW index. We note that in the United States region, competitors delivered a slightly worse performance than our flagship multi-factor index with no risk control option, while in the Developed ex-US region, competitors delivered a similar performance compared to the latter.
We stress the importance of the different risk control options that we provide to investors in order to control non-factor risks such as sector and market beta gap. For the same performance engine represented by the exposures to the same six factors and the same weighting schemes used to diversify away specific risks, which increases the risk-adjusted performance associated with each factor, the investor, depending on their fiduciary choices, obtains different pay-offs for their factor strategy that are in line with the risk objectives. In Q1 2020, controlling for the market beta gap was obviously negative since cap-weighted indices delivered strong negative returns. However, over the long-term, correcting for the market beta gap is positive.
What are the Sources of Performance of Factor Strategies?
The performance of factor strategies is based on three main elements, namely the exposure to rewarded factors, the good diversification of unrewarded idiosyncratic risk and the management of systematic non-factor risks that are detailed further in the following paragraphs.
Factor Performance
Factor performance over the first quarter of 2020 was mixed and very strong in magnitude. Indeed, for the US, the Size, Value and Investment factors experienced strong negative returns that were well below their worst 5% quarterly performance observed since 2002. However, over a long-term period of 45 years based on the EDHEC-Risk US Long-Term Track Record universe, these performances are in line with the average performance below the worst 5% quarterly observations. In contrast, Momentum, Profitability and Low Volatility posted strong positive returns, which were above their best 5% quarterly performance in the case of the first two factors. Overall, the average factor risk premium of the consensual six-factor long/short market-neutral factors was negative for the US (-1%), dragged down by the underperformance of the Size and Value factors.
Exhibit 2: Performance of Long/Short Factors over Q1 2020
Region
|
Statistics |
SMB |
HML |
MOM |
VOL |
PRO |
INV |
Average |
United States |
Q1 2020 |
-13.6% |
-16.1% |
16.8% |
6.6% |
8.8% |
-8.4% |
-1.0% |
Avg. Rolling Quarterly Return |
0.1% |
0.0% |
0.1% |
1.8% |
0.8% |
0.2% |
0.5% |
|
Worst 5% Rolling Return |
-5.9% |
-5.6% |
-7.5% |
-6.4% |
-4.1% |
-3.5% |
-5.5% |
|
| Best 5% Rolling Return | 7.4% |
6.0% |
8.9% |
10.5% |
6.6% |
4.3% |
7.3% |
|
Developed ex USA |
Q1 2020 |
-6.5% |
-11.9% |
15.2% |
7.6% |
4.1% |
-1.8% |
1.1% |
Avg. Rolling Quarterly Return |
2.2% |
0.4% |
1.6% |
2.0% |
0.8% |
0.0% |
1.2% |
|
Worst 5% Rolling Return |
-7.6% |
-5.8% |
-5.3% |
-5.3% |
-2.6% |
-2.8% |
-4.9% |
|
Best 5% Rolling Return |
13.2% |
6.0% |
8.4% |
9.8% |
4.6% |
3.3% |
7.6% |
|
Global |
Q1 2020 |
-9.3% |
-13.8% |
15.6% |
6.3% |
6.2% |
-5.5% |
-0.1% |
Avg. Rolling Quarterly Return |
2.2% |
0.4% |
1.6% |
2.0% |
0.8% |
0.0% |
1.2% |
|
Worst 5% Rolling Return |
-4.8% |
-5.0% |
-6.1% |
-4.7% |
-2.4% |
-2.8% |
-4.3% |
|
Best 5% Rolling Return |
6.6% |
5.9% |
7.6% |
9.1% |
5.0% |
3.2% |
6.2% |
We use daily USD total returns from 21-Jun-2002 to 31-Mar-2020 in the SciBeta US, Developed ex-US and Global universes. All statistics are calculated on a rolling basis over a 1-quarter window size, with a 1-week step size. Average rolling quarterly return denotes the mean of the quarterly rolling return time-series of each factor. Worst (Best) 5% rolling return is the fifth (ninety-fifth) percentile of the quarterly rolling returns time-series of each factor. The Market factor is the difference in return of the cap-weighted index of all stocks that constitute the index portfolio and the risk-free rate. The Size factor is the return series of an equal-weighted portfolio that is long small market-cap stocks and short the top 30% stocks (large market-cap stocks) sorted on market capitalisation in descending order. The Value factor is the return series of an equal-weighted portfolio that is long for the top 30% stocks (value stocks) and short for the bottom 30% stocks (growth stocks) sorted on book-to-market value in descending order. The Momentum factor is the return series of an equal-weighted portfolio that is long the winner stocks and short the loser stocks. The winner stocks (inversely the loser stocks) are defined as the top 30% (inversely the bottom 30%) of stocks, sorted on the past 104 weeks' compounded returns excluding the most recent month, in descending order. The Volatility factor is the return series of an equal-weighted portfolio that is long the bottom 30% stocks (low volatility stocks) and short the top 30% stocks (high volatility stocks) sorted on past volatility in descending order. The Profitability factor is the return series of an equal-weighted portfolio that is long the top 30% stocks (high profitability stocks) and short the bottom 30% stocks (low profitability stocks) sorted on gross profitability in descending order. The Investment factor is the return series of an equal-weighted portfolio that is long the bottom 30% stocks (low investment stocks) and short the top 30% stocks (high investment stocks) sorted on two year asset growth in descending order. All factors considered are market beta neutralised quarterly using ex-post CAPM beta over the quarter.
For the Developed ex-US universe, we observe the same factor winners and losers, except that only the Value and Momentum factors posted returns below and above their worst and best 5% quarterly performance respectively. Unlike the US, the average factor risk premium of the consensual six-factor long/short market-neutral factors was positive. Finally, for the Global region, the picture is very similar to the US, since the latter represents almost 50% of the universe. The Size, Value and Investment factors delivered performance that was lower than their worst 5% quarterly performance since 2002, while Momentum and Profitability posted strong returns above their best 5% quarterly performance.
There are explanations for the very mixed performances of the factors, even though some of them have extreme values, as is the case for Value and Size. The COVID-19 crisis and the suspension of economic activity that followed had a very strong impact on factors in line with their exposure to credit risk (the case of Size) or their varying exposure to business and asset reversibility risk. This is a phenomenon that is not only found in exposure to the Value factor but also in the level of tangible assets in place in the company (see Exhibit 3). As such, the performances of factors such as Low Volatility, High Profitability and Momentum benefited from their low level of exposure to stocks with the highest value of tangible assets.
Exhibit 3: Percentage of Long/Short Factor Stocks in the Top/Bottom 10% Tangible Stocks in the SciBeta US Region in Q1 2020
Factor
|
Selections |
% of Stocks Belonging to the Top 10% Tangible Stocks |
% of Stocks Belonging to the Bottom 10% Tangible Stocks |
SMB
|
Small Cap |
26% |
28% |
Large Cap |
28% |
20% |
|
HML
|
Value |
60% |
24% |
Growth |
8% |
30% |
|
MOM
|
High Momentum |
30% |
42% |
Low Momentum |
36% |
22% |
|
VOL
|
Low Volatility |
22% |
40% |
High Volatility |
54% |
22% |
|
PRO
|
High Profitability |
2% |
18% |
Low Profitability |
64% |
24% |
|
INV |
Low Investment |
18% |
32% |
High Investment |
22% |
24% |
The table displays the percentage of stocks within each branch of our long/short factors as defined in Exhibit 2 that belongs to the top/bottom 10% tangible stocks over Q1 2020.
Overall, we can say that the average contributions of the six long-term rewarded factors have been negative on the whole for the quarter but that this negative contribution remains limited, comes essentially from the US region and depends on three factors out of six. The very pronounced underperformance of the Value, Size and Investment factors is nonetheless consistent with the long-term track record of these factors and is justified by economic rationales that are the source of the existence of a long-term risk premium.
In conclusion, since our multi-factor indices offer strong exposure to the six well-rewarded risk factors but also good factor deconcentration, meaning that exposures are well-balanced across factors, our indices were penalised by the performance of the Size, Value and Investment factors. However, over the long-term, these rewarded factors delivered strong risk-adjusted returns and only a good factor deconcentration, which allows to benefit from their decorrelation, is able to guarantee the robustness of outperformance of multi-factor strategies (see Exhibit 4).
Exhibit 4: Factor Contribution Analysis Over the Last 15 Years Between Scientific Beta Multi-Factor Indices and Competitor Strategies
Factor Contribution |
HFI MBMS 6F 4S EW |
HFI MBMS 6F 4S SN EW |
HFI MBMS 6F 4S EW MBA |
HFI MBMS 6F 4S SN EW MBA |
Avg. Competitors |
United States – Last 15 Years |
|||||
Factor Contribution |
0.9% |
-0.3% |
0.9% |
-0.3% |
-0.2% |
| Factor Intensity (Int) | 0.90 |
0.82 |
0.96 |
0.83 |
0.60 |
| Factor Deconc (ENF) | 5.25 |
5.30 |
5.26 |
5.25 |
3.89 |
Factor Exp. Quality (Int x ENF) |
4.74 |
4.34 |
5.04 |
4.39 |
2.42 |
Developed ex USA – Last 15 Years |
|||||
Factor Contribution |
2.1% |
2.0% |
2.1% |
2.0% |
0.9% |
| Factor Intensity (Int) | 0.96 |
0.91 |
0.97 |
0.91 |
0.73 |
| Factor Deconc (ENF) | 5.63 |
5.81 |
5.60 |
5.82 |
3.43 |
Factor Exp. Quality (Int x ENF) |
5.41 |
5.26 |
5.41 |
5.30 |
2.48 |
The analysis is based on weekly USD total return data from 31-Mar-2005 to 31-Mar-2020. CW is the SciBeta Cap-Weighted index. Indices used are the SciBeta HFI Diversified MBMS 6F 4S EW, SciBeta HFI Diversified MBMS (Sector Neutral) 6F 4S EW, SciBeta HFI Diversified MBMS 6F 4S EW MBA CW Overlay, SciBeta HFI Diversified MBMS (Sector Neutral) 6F 4S EW MBA CW Overlay based on the US and Developed ex-US regions. Competitors' indices or funds are based on the average of the Russell 1000 Comprehensive Factor, JPMorgan Diversified Factor US Equity, MSCI USA Diversified Multi-Factor, MSCI USA Factor Mix, S&P GIVI US, RAFI Multi-Factor U.S. Index, RAFI Dynamic Multi-Factor U.S. Index for the US panel and the FTSE Developed ex US Comprehensive Factor, JP Morgan Diversified Factor International, MSCI World ex USA Diversified Multi-Factor, S&P GIVI Developed Ex-US, RAFI Developed ex US Multi- Factor, RAFI Developed ex US Dynamic Multi-Factor. L/S factors are constructed as in Exhibit 2. All factors considered are market beta neutralised quarterly using ex-post CAPM beta over the quarter. Regressions are performed using weekly returns. Factor Intensity is the sum of factor exposures. Factor Deconcentration is the inverse of the sum of squared relative betas. Factor Exposure Quality is the Factor Intensity multiplied by Factor Deconcentration.
Diversification
The second explanation, and probably the major one, is the concentration of performance in the largest stocks, which played a safe-haven investment role during this crisis across all regions. Indeed, when we examine the performance of the largest 5% stocks compared to the performance of their cap-weighted benchmark (see Exhibit 5), we underline that across all regions and particularly in the midst of the crisis, i.e. in March, large caps outperformed their cap-weighted benchmarks. Over the quarter, the outperformance ranges between 3.5% for Developed ex-US and 5.3% for Global. Finally, we emphasise that this outperformance was stronger in March but was also significant in January. In these circumstances, weighting schemes that diversify across stocks and have a much higher effective number of stocks than concentrated cap-weighted indices are not effective, unlike what we observe over the long-term, because since the inception of the indices, and very logically, the concentration of cap-weighted indices is the source of large annual underperformance. Moreover, the conjunction of extreme idiosyncratic volatility as well as cross-sectional correlations that skyrocketed make diversification benefits less effective since stocks behaved very similarly.
Exhibit 5: Relative Return of the Largest 5% Stocks in Cap-Weighted Indices
Largest 5% Stocks |
United States |
Developed ex USA |
Global |
Q1 2020 |
3.7% |
3.5% |
5.3% |
Jan-20 |
1.3% |
0.2% |
1.2% |
Feb-20 |
-0.5% |
0.2% |
0.3% |
Mar-20 |
3.4% |
3.6% |
4.5% |
Since Inception (annualised) |
-.1.0% |
-1.7% |
-0.3% |
The table reports the relative performance of the top 5% stocks based on their free-float market capitalisation relative to their corresponding broad cap-weighted index over Q1 2020, January 2020, February 2020, March 2020 and since inception (21-Jun-2002). The last date is 31-Mar-2020. US, Developed ex-US and Global performances are expressed in USD. Returns for Q1 2020, Jan-20, Feb-20 and Mar-20 are not annualised. Returns since inception are annualised.
Non-Factor Risks – Market Risk
Market beta drives much of the performance and risk of multi-factor indices. The consequences of the underexposure (CAPM beta lower than 1) of most factor strategies is often disregarded. Exhibit 6 provides the market beta bias in Q1 2020 and since inception of the HFI MBMS 6F 4S EW index across the US, Developed ex-US and Global regions. We observe that the CAPM market betas over the first quarter were close to one across the different regions. This is in stark contrast to the defensive characteristics of our multi-factor indices, which display defensiveness with market betas ranging from 0.83 to 0.98 since inception. However, we note that these levels are extreme but in line with the highest 5% observations of quarterly market betas since inception. We underscore the large variability in the market betas over the quarter, since in January they were below the historical average for the US and Global regions, and then gradually increased in February and March to reach an extreme 5% high in only two months. This increase in market beta was already observed in previous crises such as that of 2008.
Exhibit 6: CAPM Market Beta Exposures of Scientific Beta HFI MBMS 6F 4S EW Indices Over Q1 2020 and Since Inception Across US, Developed Ex-US and Global Regions
CAPM Market Beta
|
Since Inception |
Q1 2020 |
Mar-20 |
Feb-20 |
Jan-20 |
Highest 5% |
Cond. Avg. (<highest 5%) |
United States
|
0.88 |
0.99 |
1.00 |
0.90 |
0.81 |
1.00 |
1.03 |
Developed ex USA
|
0.83 |
0.97 |
0.97 |
0.95 |
0.92 |
0.97 |
0.99 |
Global
|
0.84 |
0.98 |
0.99 |
0.92 |
0.83 |
0.96 |
0.99 |
Market betas since inception are computed from Jun-2002 to Dec-2019 with weekly USD excess total returns over the risk-free rate. Q1 2020, Mar-20, Feb-20 and Jan-20 market betas are computed using daily USD excess total returns over the risk-free rate over each defined period. The highest 5% is the fifth percentile of highest quarterly rolling market beta. Quarterly rolling market betas are computed using the last 65 days of daily USD excess total returns over the risk-free rate with weekly steps from Sep-2002 to Mar-2020. The conditional average ( > highest 5%) is the average quarterly rolling market beta when above the highest 5% level. We use the SciBeta Cap-Weighted as proxy for the market returns.
Given the high market beta, the impact of the negative market performance on our multi-factor indices was weak. Indeed, we observe in Exhibit 7 that the impact ranges from 0.14% for the US to 0.63% for Developed ex-US.
Exhibit 7: Impact of the Market Beta Gap on the Performance of Scientific Beta HFI MBMS 6F 4S EW Indices Across US, Developed Ex-US and Global Regions
Q1 2020
|
Market Gap |
Market Performance |
Impact of Gap |
United States
|
-0.01 |
-19.23% |
0.14% |
Developed ex USA
|
-0.03 |
-23.10% |
0.62% |
Global
|
-0.02 |
-21.09% |
0.32% |
Market betas are estimated as defined in Exhibit 4a. The market beta gap is the market beta of the index minus one. The impact of the gap is the product of the market beta gap and the market performance.
Non-Factor Risks – Sector Risk
In long-only investment, there is no orthogonality between factors and sectors. Factors can therefore lead to important sector biases compared to the cap-weighted benchmark, which can impact positively or negatively the short-term relative performance of multi-factor indices.
In Exhibit 8, we show the quarterly performance contribution of sectors on the HFI MBMS 6F 4S EW standard and sector-neutral versions across the US, Developed ex-US and Global universes. We underscore that sectors had a negative sector performance contribution, especially in the US and Global regions, over the quarter and Cyclical Consumer was the most penalising sector across all regions.
Exhibit 8: Sector Performance Contribution Over Q1 2020 and the Last 10 Years of Scientific Beta HFI MBMS 6F 4S EW Indices Across US, Developed Ex-US and Global Regions
Region
|
United States |
Developed ex USA |
Global |
|||
Period
|
Q1 2020 |
10Y |
Q1 2020 |
10Y |
Q1 2020 |
10Y |
Energy |
-0.27% |
-0.09% |
0.83% |
0.02% |
0.14% |
-0.02% |
Basic Materials |
0.11% |
0.02% |
-0.58% |
0.13% |
-0.08% |
0.08% |
Industrials |
0.25% |
0.02% |
-0.07% |
0.08% |
0.10% |
0.06% |
Cyclical Consumer |
-2.62% |
0.10% |
-0.97% |
0.14% |
-1.91% |
0.12% |
Non-Cyclical Consumer |
-0.36% |
0.20% |
-0.01% |
0.15% |
-0.30% |
0.18% |
Financials |
-0.61% |
-0.12% |
0.08% |
-0.06% |
-0.18% |
-0.10% |
Healthcare |
0.16% |
0.14% |
0.47% |
0.05% |
0.21% |
0.09% |
Technology |
0.00% |
-0.37% |
-0.32% |
0.02% |
0.08% |
-0.21% |
Telecoms |
0.37% |
-0.03% |
-0.15% |
0.05% |
0.05% |
0.01% |
Utilities |
-1.18% |
0.18% |
-0.57% |
0.05% |
-0.99% |
0.11% |
Average |
-0.41% |
0.00% |
-0.13% |
0.06% |
-0.29% |
0.03% |
Based on daily total returns in USD from 31-Dec-2019 to 31-Mar-2020 for Q1 2020 and from 31-Mar-2010 to 31-Mar-2020 for the last 10 years. Performance contributions to sectors are the average of quarterly contributions over the defined period. For 2020, performance contributions refer to the quarter.
We observe in Exhibit 9 that the four different Cyclical Consumer business sectors behave very differently over the quarter and especially in March. Automobiles and Auto Parts and Cyclical Consumer Services were the sub-components of the Cyclical Consumer sector that were the most affected in March (-12.7% and -8.2% of relative performance respectively), whereas the Retailers sub-component outperformed by 6.8%. The COVID-19 crisis positively or negatively affected very specific sub-segments of the economy that an aggregated sector classification such as the TRBC Economic sector is not able to capture.
Exhibit 9: Economic and Business Sector Quarterly Relative Performance of the US Consumer Cyclical Sector and its Sub-Components in Q1 2020
Sector Group |
Q1 2020 |
Mar-20 |
Feb-20 |
Jan-20 |
Cyclical Consumer |
0.8% |
-0.5% |
0.5% |
1.1% |
Automobiles & Auto Parts |
-5.4% |
-12.7% |
2.3% |
6.4% |
| Cyclical Consumer Products | -7.5% |
-4.7% |
-1.5% |
-2.5% |
Cyclical Consumer Services |
-11.0% |
-8.2% |
-2.2% |
-2.4% |
Retailers |
11.6% |
6.8% |
2.3% |
3.5% |
This table reports the relative performance over the cap-weighted benchmark of the Cyclical Consumer Economic Sector and its sub-sectors over Q1 2020 and each month.
Conclusion
The first, but not the main, explanation for the underperformance of our multi-factor indices in the first quarter of 2020 is the overall negative contribution of risk factors, notably for the US region. Indeed, our multi-factor indices have strong and well-balanced exposures to all six risk factors. The Size, Value and Investment factors contributed negatively to the overall factor contribution and dragged down the positive contribution from the Momentum, Profitability and Low Volatility factors. We highlight that over the long-term, only strong factor deconcentration can guarantee the robustness of the outperformance of factor strategies, since they will benefit from factor decorrelation and their long-term reward, even though implicit or explicit factor imbalances can provide better relative performance by chance over the short-term.
The second explanation, and probably the major one, is the concentration of performance in the largest stocks, which played a safe-haven investment role during this crisis across all regions. As a result, this penalised well-diversified portfolios such as our multi-factor indices. In addition, the conjunction of extreme levels of cross-sectional dispersion of returns as well as average correlation of stocks made diversification benefits ineffective.
Finally, the last important explanation for the underperformance of our multi-factor indices, and a very important one, is non-factor risks. The first non-factor risk is the market beta gap. Factor strategies tend to be defensive, with a market beta below one. This is the case for our multi-factor strategies, on average, but this quarter was marked by a compression of market betas, which means that low beta stocks became higher beta and high beta stocks became lower beta. Our multi-factor indices were therefore less defensive than expected and were impacted by the strong market losses. The second non-factor risk is sector risk. Our multi-factor indices were particularly impacted by the Cyclical Consumer sector.
Performance Over the Last 15 Years of Multi-Beta Multi-Strategy Indices
The table below reports the performance over the last 15 years of the Scientific Beta Multi-Beta Multi-Strategy indices for the United States and Developed ex USA regions as of 31 March, 2020 for our multi-factor indices with or without different risk control options such as sector neutrality, market beta adjustment and the combination of the two latter options.
Exhibit 1: Performance of the HFI MBMS 6F 4S EW Index with Different Risk Control Options and the Average of Competitors Over the Last 15 Years
Last 15 Years Mar-2005 to Mar-2020 |
Std |
SN |
MBA |
SN + MBA |
Avg. Competitors |
United States |
|||||
Ann. Returns |
9.03% |
9.15% |
9.72% |
9.52% |
8.19% |
| Ann. Volatility | 17.69% |
18.29% |
20.50% |
20.63% |
18.73% |
| Sharpe Ratio | 0.44 |
0.43 |
0.41 |
0.40 |
0.37 |
| Ann. Rel. Returns | 1.30% |
1.42% |
1.99% |
1.79% |
0.46% |
Ann. Tracking Error |
4.10% |
3.45% |
3.60% |
3.23% |
3.45% |
Information Ratio |
0.32 |
0.41 |
0.55 |
0.55 |
0.17 |
Extreme Tracking Error |
6.4% |
5.5% |
4.8% |
4.8% |
4.9% |
Market Beta |
0.91 |
0.95 |
1.05 |
1.06 |
0.96 |
Developed ex USA |
|||||
Ann. Returns |
6.67% |
6.28% |
7.03% |
6.63% |
5.68% |
| Ann. Volatility | 15.24% |
15.39% |
17.64% |
17.64% |
16.44% |
| Sharpe Ratio | 0.35 |
0.32 |
0.33 |
0.30 |
0.27 |
| Ann. Rel. Returns | 2.84% |
2.46% |
3.20% |
2.80% |
1.86% |
Ann. Tracking Error |
3.73% |
3.43% |
2.66% |
2.44% |
3.89% |
Information Ratio |
0.76 |
0.72 |
1.20 |
1.15 |
0.47 |
Extreme Tracking Error |
6.3% |
5.7% |
3.8% |
3.3% |
5.8% |
Market Beta |
0.86 |
0.88 |
1.00 |
1.01 |
0.92 |
The analysis is based on daily USD total returns from 31-Mar-2005 to 31-Mar-2020 in the SciBeta USA and Developed ex-US universes. All statistics are annualised. Extreme tracking error is the worst 5% 3-year rolling tracking error. Indices used are the SciBeta HFI Diversified MBMS 6F 4S EW or Std in the table, SciBeta HFI Diversified MBMS (Sector Neutral) 6F 4S EW (SN) or SN in the table, the SciBeta HFI Diversified MBMS 6F 4S EW MBA (Overlay) or MBA in the table and the SciBeta HFI Diversified MBMS (Sector Neutral) 6F 4S EW Market Beta Adjusted (Overlay) or SN + MBA in the table. Competitors' indices in the US universe are the MSCI USA Diversified Multi-Factor index, the MSCI USA Factor Mix, the JPMorgan Diversified Factor US, the S&P GIVI US, the RAFI USA Multi-Factor index, the RAFI Dynamic Multi-Factor US and the Russell 1000 Comprehensive Factor index. Competitors' indices in the Developed ex-US universe are the FTSE Developed ex US Comprehensive Factor, the JP Morgan Diversified Factor International, the MSCI World ex USA Diversified Multi-Factor, the S&P GIVI Developed Ex-US, the RAFI Developed ex US Multi- Factor, the RAFI Developed ex US Dynamic Multi-Factor.
Over the last 15 years, all our indices outperformed the cap-weighted index across the US and Developed ex-US regions and also outperformed the average of competitors. This is the result of the factor deconcentration and good factor exposure quality of our multi-factor indices and highlights the benefits of our investment philosophy. The table also shows the basis for the existence of the proposed risk control options. Although the sector neutral options allow the tracking error and extreme tracking error to be managed, this control comes at the expense of factor intensity, given that factor exposure is not orthogonal with sector bets. The MBA option allows full access to performance but also to market risk. The highest excess return obtained thanks to this option does not therefore translate into the highest absolute risk-adjusted performance as expressed by the Sharpe ratio but more as the maximisation of the Information ratio since this superior excess return also corresponds to a strong reduction in tracking error associated with the minimisation of the market beta component of this tracking error.
![]()
Quarterly Scientific Beta Developed Multi-Smart Factor Indices Performance Factsheet, March 2020
Publications

Documents authored by Scientific Beta, featuring research in the field of smart beta or on related topics.
White Papers
In a concern for transparency, and as part of its aim to help investors to understand and to invest in smart beta equity strategies, Scientific Beta has published a large number of white papers that are available on the Scientific Beta platform.
Featured White Papers
Designing More Defensive Solutions – A new solution that really is low volatility
April 2020
 Defensive equity solutions are popular strategies because they provide better downside protection while also delivering good risk-adjusted returns, since they are exposed to the Low Volatility risk premium. However, traditional defensive solutions suffer from some clearly identifiable drawbacks, notably negative exposures to other rewarded factors or a lack of diversification.
In this new publication, Scientific Beta details its robust dynamic defensive solution. This offering addresses the drawbacks of traditional defensive strategies and notably provides a reduction in market beta and volatility in distressed times, i.e. it is defensive when needed most. This new solution allows volatility to be smoothed through time and consequently improves average and extreme risks as well as risk-adjusted returns. This strategy notably allowed the maximum loss observed in the first quarter of 2020 following the Covid-19 crisis to be reduced by 32% compared to the reference cap-weighted index.
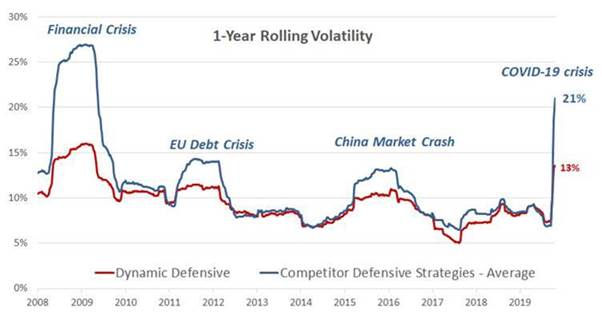
In addition, Scientific Beta offers a decarbonised version for investors who care about climate change. Defensive strategies, relative to a cap-weighted index, tend to exhibit higher carbon metrics as shown by their weighted average carbon intensity and carbon footprint. Our Low Carbon screening process produces a sharp reduction in carbon exposure while conserving defensiveness and risk-adjusted performance.
SciBeta Developed |
Climate Change Dynamic Defensive Solution |
Dynamic Defensive Solution |
MSCI World Minimum Volatility |
As of March 2020 |
|||
WACI (scope 1+2) |
-31% |
+199% |
+205% |
WACI (scope 1+2+3) |
-41% |
+118% |
+115% |
Last 10 Years (March 2010-March 2020) |
|||
| Volatility Reduction | -36% |
-34% |
-27% |
| Sharpe Ratio Improvement | 100% |
88% |
82% |
| 1Y Rolling Volatility Worst 5% | 11.2% |
11.2% |
13.0% |
Low Vol Mkt - Mkt Beta |
0.72 |
0.71 |
0.63 |
High Vol Mkt - Mkt Beta |
0.56 |
0.57 |
0.68 |
Weighted Average Carbon Intensity (WACI) is the average exposure of portfolio to carbon-intensive companies expressed in tons of CO2e per (USD) million of revenues. Scope 1 plus Scope 2 emissions are used. Data are computed each quarter from 31-Mar-2010 to 31-Mar-2020. Universe is SciBeta Developed.
Find out more about Scientific Beta's new dynamic defensive solution by participating in our dedicated webinar on 4 June, 2020 at 4.00pm CET.
Supplements in Partnership with Industry Publications
EDHEC has established partnerships with a number of industry publications to produce special editorial supplements providing industry-relevant research of the highest academic standards.
P&I Research for Institutional Money Management
December 2019

The latest issue of the P&I Research for Institutional Money Management is a Scientific Beta special aiming to bring scientific clarity to many questions that are too often approached in an anecdotal way and in any event without real and serious empirical evidence. Articles look at the price effects of rebalancing trades on factor indexes, the continued place of the size factor in multi-factor portfolios, and the analysis of the macroeconomic risk of equity factors. The supplement also presents the different elements of Scientific Beta's index offering.
Are There Price Effects Around the Rebalancing of Factor Indexes?
We first investigate whether the performance of factor indexes suffers from stock prices' reactions to rebalancing trades and find that, unlike for cap-weighted indexes, there has been no significant price effect.
Is There Still a Role for the Size Factor in Multi-Factor Portfolios?
The academic literature sees the size factor as an important driver of return differences across equity portfolios. In fact, removing the size factor deteriorates explanatory power more than removing any of the other standard factors does.
How to Achieve Good Reward and Sound Risk Management with Single Factor Indexes
Scientific Beta offers investors single smart-factor indexes as long-only or long/short indexes. The indexes are constructed consistently and seek robustness at all stages of the construction process.
Integrating Macroeconomic Conditions into Multi-Factor Allocation
We propose a methodology for analysing the macroeconomic risk of equity factors, and show that ignoring such risks may lead to under-diversification of multi-factor portfolios.
How to Add Value with Factor Indexes
Smart factor indexes ensure a good reward for the exposures captured through diversification of unrewarded (specific) risk, improving long-term risk-adjusted performance while reducing short- and medium-term risk.
Supporting the Transition to a Low Carbon Economy: the Scientific Beta low Carbon Option
This option addresses the three most common decarbonization objectives for investors: contributing to the transition to a low-carbon economy, reducing the 'carbon footprint' of investments and reducing exposure to climate change risks.
Upholding Global Norms and Protecting Multi-Factor Indexes Against ESG Risks: the Scientific Beta ESG Option
Enables investors to dissociate from controversial companies, demonstrate support of global norms, mitigate reputational and liability risks or avoid ESG risks with potential adverse financial materiality, while retaining financial outperformance.
EDHEC Scientific Beta Advanced Factor & ESG Investing Research Chair

News from the research chair launched in 2019 to provide high-quality research for decision-makers in the professional arena.
A Transaction-Cost Perspective on the Multitude of Firm Characteristics
In 2019, Scientific Beta gave its support to the creation by EDHEC Business School of an academic research chair. Within this framework, a publication entitled "A Transaction-Cost Perspective on the Multitude of Firm Characteristics" from the EDHEC-Scientific Beta "Advanced Factor & ESG Investing" research chair has been published in the May 2020 issue of The Review of Financial Studies.
 A Transaction-Cost Perspective on the Multitude of Firm Characteristics
Victor DeMiguel, Alberto Martín-Utrera, Francisco J Nogales, Raman Uppal
The Review of Financial Studies, Volume 33, Issue 5, May 2020, Pages 2180–2222
This publication investigates how transaction costs change the number of characteristics that are jointly significant for an investor's optimal portfolio, and hence, how they change the dimension of the cross-section of stock returns. It finds that transaction costs increase the number of significant characteristics from six to fifteen. The explanation is that, as the paper shows theoretically and empirically, combining characteristics reduces transaction costs because the trades in the underlying stocks required to rebalance different characteristics often cancel out. Thus, transaction costs provide an economic rationale for considering a larger number of characteristics than that in prominent asset-pricing models.
![]()
A Transaction-Cost Perspective on the Multitude of Firm Characteristics, EDHEC-Scientific Beta "Advanced Factor & ESG Investing" research chair publication, June 2019
More About the EDHEC Scientific Beta Advanced Factor & ESG Investing Research Chair

Virtual Annual Client Seminars
Scientific Beta has organised virtual seminars reserved for our clients on 28 April for North America and 5 May for Europe and the rest of the world.
These seminars are an opportunity to discuss the challenges for our June 2020 release with clients and to present the developments envisaged for the factor offering. The seminars also covered topics such as index rebalancing in exceptional market circumstances, the new robustness analysis analytics on the Scientific Beta platform and Scientific Beta’s research and product plan for 2020-2021.
Finally, on the occasion of this annual client seminar, Professor Noël Amenc, CEO, and Dr Eric Shirbini, Global Research and Investment Solutions Director with Scientific Beta, discussed the prospects for smart beta management in a context of extreme market volatility.
For clients wishing to participate in the virtual seminar on 5 May, 2020, please contact our Client Services department at clientservices@scientificbeta.com or on +33 493 187 851 (from 3.00am to 11.00pm CET).
Core ESG Survey
Since June 2019, Scientific Beta clients who so wish can avail free of charge of the Core ESG filter that is incorporated into the Low Carbon and ESG options offered on Scientific Beta indices.
Anchored in international norms, the Core ESG filter is a collection of negative screens that span consensual product- and conduct-based exclusions.
Scientific Beta is currently surveying clients on a potential evolution of the Core ESG filter on the occasion of the June 2020 rebalancing. Questions pertain to the perceived relevance of extending controversial weapon exclusions to cover weapons of mass destruction and of hardening the exclusions applicable to companies with significant involvement in the dirtiest forms of fossil fuels.
Clients interested in participating in the survey may do so until the 7 May, 2020 by contacting our Client Services department at clientservices@scientificbeta.com or on +33 493 187 851 (from 3.00am to 11.00pm CET).
"Business as Usual" for Scientific Beta During the Global Pandemic
The Coronavirus outbreak is having a growing impact on the global economy. Here at Scientific Beta, our activities are continuing normally, with all of our teams in our Nice, Paris, London, Boston and Singapore offices remaining fully operational in a "business as usual" capacity during this unprecedented situation.
Scientific Beta is taking all necessary actions to prevent and limit as much as possible the potential Covid-19 outbreak impacts on our operations with the ultimate aim of protecting our employees' health and safety and ensuring continuity of service without any disruption for our clients.
In this context, and in line with our Business Continuity Plan, we have taken a set of preventive and continuity measures, applicable before, during and after lockdown, that concern all our locations and are constantly reviewed in order to be as relevant as possible to the situation as it evolves:
Operations continuity measures: Human resources and IT arrangements have been made to allow all Scientific Beta employees to be in a position to work remotely. Team leader and deputy have been segregated from each other to limit contagion risk within the same team, redundancy of competencies within the operating teams and ability of all operating teams’ members to work remotely have been ensured.
Employee protection measures: A detection process has been implemented to avoid employees exposed to high risk areas or to positively tested people and/or presenting Covid-19 symptoms to enter the Scientific Beta premises. Particular protection measures for people at risk in the case of Covid-19 have also been put in place.
Travel and meeting restrictions: Travel and meeting restrictions have been put in place with the cancellation of all physical meetings that it was possible to cancel in favour of virtual solutions. Travel to high-risk areas is prohibited. Internal and external meetings involving more than five people from our organisation are subject to the CEO’s approval.
Visitor health check: Visitor health screening has been put in place to reduce the exposure of Scientific Beta staff. Access to Scientific Beta sites is restricted for people having visited high risk areas within the last 14 days.
Although we are currently organising virtual events, we have taken the decision to maintain our flagship Scientific Beta Days conferences in Europe and North America in the autumn for the moment, as we believe that it is important to keep sight of a return to normal in the coming months.
Our Client Services department remains at your disposal to answer any questions or queries you may have. Please contact them by e-mail on clientservices@scientificbeta.com or by telephone on +33 493 187 851 (from 3.00am to 11.00pm CET).
Forthcoming Events

As smart beta is a new frontier for the investment industry, research and education on this subject are a core part of Scientific Beta's strategy. That is why we regularly invite interested parties to participate in events on the subject of smart beta investing.
Conferences
EDHEC Scientific Beta Days Europe and North America 2020
6-7 October, 2020 – Barbizon Palace, Amsterdam, Netherlands
15-16 October, 2020 – Revere Hotel, Boston, United States

These annual two-day conferences, organised by Scientific Beta, will present the asset owner and financial advisory communities with the latest conceptual advances and research results in smart beta investing, enabling their implications and applications to be discussed with researchers who combine expertise of advanced financial techniques with a sound awareness of their industry relevance. The events will include multiple plenary sessions, workshops and practical sessions allowing professionals to review major industry challenges, explore state-of-the-art investment techniques and benchmark practices to advances in research.
The 2020 edition of the conference will focus on the need to question smart strategies:
- Redefining Value to better account for intangible investments
- Navigating the factor zoo: differentiating between fake and robust rewarded factors
- ESG investing: popular misconceptions and misselling
- Redefining sector neutrality to better protect portfolios from non-factor events and risks
- Facing the limitations of traditional defensive strategies
- The false promises of superior performance of ESG and low carbon investing
- Improving performance of LDI strategies
- Not so smart ideas regarding smart beta
Further details are available in the respective programmes:
 |
 |
The conference is reserved for asset owners (including pension schemes, charities, endowments, foundations, insurance companies, single family offices and financial executives from non-financial companies) consultants and investment advisers. Admission is complimentary and by invitation only.
For further information about this event, please contact Joanne Finlay at scientificbetadays@scientificbeta.com.
During the current global pandemic, we believe that it is important to keep sight of a return to normal in the coming months and would like to send a positive message in this difficult period by maintaining our autumn conferences. Registrations can of course be reviewed as the situation evolves.
Webinars
Improving Factor Diversification of an Existing Portfolio
14 May, 2020 – 16:00 CET / 10.00 am EST

Good factor diversification is an essential element of the robustness of portfolio performance over the long term, and it is with this in mind that Scientific Beta launched a new service in 2019 named Scientific Beta Factor Analytics Services, which aims to evaluate and improve the diversification of global equity portfolios, whatever their composition. A link to an overview of this service can be found here.
In concrete terms, asset owners can improve the robustness of traditional strategies by correcting unbalanced factor exposures. As an illustration below, we use Scientific Beta long/short indices as completeness ingredients for a portfolio benchmarked to a traditional defensive index. Without changing the defensive bias of this index, whether involving low volatility exposure or low market beta, by improving its factor intensity and notably the undesired negative exposures to the other long-term rewarded factors, it is possible to improve the risk-adjusted ratio of this portfolio considerably.
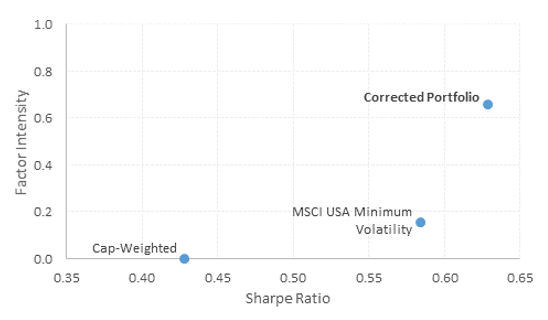
To participate in the webinar, please visit the dedicated registration web page.
For further information about this event, please contact Séverine Cibelly at severine.cibelly@scientificbeta.com.
A New Dynamic Defensive Solution That is Really Low Volatility
4 June, 2020 – 16:00 CET / 10.00 am EST
Defensive equity solutions are popular strategies because they provide better downside protection while also delivering good risk-adjusted returns, since they are exposed to the Low Volatility risk premium.
However, traditional defensive solutions suffer from some clearly identifiable drawbacks, notably negative exposures to other rewarded factors, a lack of diversification and are not truly defensive in periods of high market volatility, at a time when lower risk is needed most. Furthermore, traditional defensive strategies suffer from high carbon exposure compared to a cap-weighted index, which in turn exposes these types of strategies to climate risk.
At a webinar that will be held on June 4, Daniel Aguet, Index Director, and Eric Shirbini, Global Research and Investment Solutions Director at Scientific Beta will detail the Scientific Beta robust dynamic defensive solution. This offering addresses the drawbacks of traditional defensive strategies and notably provides a reduction in market beta and volatility in distressed times, i.e. it is defensive when needed most. This new solution allows volatility to be smoothed through time and consequently improves average and extreme risks as well as risk-adjusted returns. This strategy notably allowed the maximum loss observed in the first quarter of 2020 following the Covid-19 crisis to be reduced by 32% compared to the reference cap-weighted index. Daniel Aguet and Eric Shirbini will also detail the decarbonised version offered for investors who care about climate change.
Topics covered will include:
- Drawbacks of traditional defensive strategies
- Presentation of the Scientific Beta Dynamic defensive solution based on a robust low volatility index and volatility forecasting method
- Reconciling defensiveness and climate change
To participate in the webinar, please visit the dedicated registration web page.
For further information about this event, please contact Séverine Cibelly at severine.cibelly@scientificbeta.com.
Past Events

Replays of recent webinars broadcast by Scientific Beta on the theme of factor investing.
How to Reconcile ESG and Factor Investing
A webinar hosted by Frédéric Ducoulombier, ESG Director, and Erik Christiansen, ESG & Low Carbon Solutions Specialist at Scientific Beta, on 6 February, 2020 explored how ESG objectives can be reconciled with factor investing and demonstrated the need to keep these two objectives separate.

Factor investing in the equity space is increasingly popular, and so is ESG investing, which brings the need to combine the two. Some providers claim that by integrating the two approaches, ESG can add to the financial returns of factor investing, thereby blurring the lines between the drivers of ESG performance and financial performance, and even denying any potential conflicts between the two. This webinar explored how ESG objectives can be reconciled with factor investing and demonstrated the need to keep these two objectives separate. The webinar examined ESG incorporation approaches for multi-factor indices, together with Scientific Beta's ESG fiduciary option.
Press Review

A selection of articles published in the international business or specialised press featuring Scientific Beta and its research.
A new route to minimising volatility
Top 1000 Funds (03/04/2020)
Article by Daniel Aguet, head of indices at Scientific Beta, Noël Amenc, chief executive at Scientific Beta and Associate Dean for business development at EDHEC Business School, and Felix Goltz, research director at Scientific Beta.
"(...) Traditional defensive strategies have been popular for many decades. In addition to providing relative protection in bear markets, they benefit from the positive long-term premia associated with the low volatility factor. Unfortunately, we can observe that the popular low volatility strategies’ strong tilt towards value is often associated with negative exposures to the other rewarded factors, which deprives these strategies of the potential for long-term risk-adjusted performance. To respond to this shortcoming, it is possible to apply a high factor intensity filter to a defensive strategy, which removes the highly negative exposures to other rewarded factors. This type of approach harvests the low volatility factor while maintaining positive exposures to other rewarded risk factors. (...)"
Copyright Conexus Financial. top1000funds.com
Should the smart money be on smart beta?
FTfm, Special Report, Exchange-Traded Funds (30/03/2020)
"(...) “The poor performances ... are not the result of a strong and abnormal deterioration in factor performances,” Prof Amenc adds. “It is clear that the pronounced bull market conditions of the last three years, notably in the US, have been unfavourable [for smart beta factors].” His solution is to implement smart beta via a market-neutral approach, which balances long and short positions to strip out the market beta, a strategy his data suggest is still broadly working, even if the value and size premia have still been negative in this format. (...)"
Copyright Financial Times
'The Singapore Exchange will give us access to the Asian market'
Asset News (09/03/2020)
Interview with Noël Amenc, CEO, Scientific Beta
"(...) The sale of most Scientific Beta shares to the Singapore Exchange (SGX) is a big event for us. We will not turn into a mere SGX department. Rather, we will pursue our activities autonomously, as a subsidiary with the backing of a group with strong ambitions in indices and data. One reason this merger was done is industrial in nature. This partnership will help us secure access to ESG data, which is strategic for our current offering of indices having ESG and low-carbon filters, as well as for our future smart ESG offerings. We will also have more resources for developing smart beta research, which is key to our success. (...)"
Copyright Asset News
On the same subject:
• Coronavirus-fuelled trading mania a boon for SGX, The Straits Times, 13/03/2020
Scientific Beta launches blistering attack on EU climate benchmark proposals
Responsible Investor (26/02/2020)
"(...) Index firm Scientific Beta has described proposals put forward under the EU Sustainable Action Plan as “champion[ing] the interests of a few select ESG data and service providers, rather than sustainability”. The firm, a unit of French investment research institution EDHEC-Risk that was acquired by Singapore Exchange earlier this year, published the criticism in response to the imminent introduction of two new regulatory product categories for green indices – Climate Transition Benchmarks (CTBs) and Paris Aligned Benchmarks (PABs) – and mandatory ESG disclosure for all benchmark providers. (...) However, Scientific Beta says the process “fail[s] to represent investors’ interests”, claiming that the plans were “drawn up hastily by a working group that was dominated by providers of ESG data and services and did not include pension funds and that it puts forward pointless and costly reporting obligations for which no impact study was carried out by the Commission”. (...)"
Copyright Response Global Media Limited
On the same subject:
• Proposals Allow ESG-Washing, Benefits and Pensions Monitor, 28/02/2020
• Scientific Beta critiques TEG benchmarks, Top 1000 Funds, 26/02/2020
Morgan Stanley launches US dollar hedged version of multi-factor US equity ETF
ETF Stream (20/02/2020)
"(...) Morgan Stanley has launched a US dollar version of its €648m multi-factor US equity ETF through its ETF platform Fundlogic. The SciBeta HFI US Equity 6F EW USD UCITS ETF (USUF) is listed on the London Stock Exchange (LSE) with a total expense ratio (TER) of 0.30% and a management fee of 0.07%. Tracking the SciBeta USA HFI MBMS EW-6F USD index, USUF is the hedged version of the SciBeta HFE US Equity 6F EW UCITS ETF (USHF), which launched as part of a five-strong range in 2017. (...)"
Copyright ETF Stream
Scientific Beta sees strong growth in assets tracking its smart beta indices
ETF Express (18/02/2020)
"(...) Scientific Beta has announced that assets tracking its smart beta indices reached USD59.2 billion at December 31, 2019, against a 2018 figure of USD43 billion, an increase of USD16 billion, corresponding to year-on-year growth of 37 per cent. Noël Amenc, CEO of Scientific Beta, says: “We are proud that the growth in Scientific Beta’s assets under replication has been one of the strongest in the smart beta market not only this year but over the last five years. In a market environment that has been challenging for factor strategies, we believe that our transparent and research-based approach to smart beta indexing has been the source of our clients’ trust in us.”. (...)"
Copyright ETF Express
Intellidex Reviews February 2020: Local ETFs
EasyEquities (17/02/2020)
"(...) We maintain the CoreShares Scientific Beta Multifactor Index ETF as our pick for investors seeking exposure to local equities. The fund fits our mould of a good investment philosophy. Its methodology tends to favour quality stocks which are highly profitable - exactly what we think investors need under prevailing economic conditions. It also considers valuations (price multiples) of the counters in its selection process, which we think is important. The fund also has a decent amount of assets under its management. (...)"
Copyright EasyEquities

As part of its international development programme and in order to strengthen its index development activity, Scientific Beta is recruiting for positions in its London and Nice offices. To apply, please send your CV and a cover letter to recruitment@scientificbeta.com.
- Salaries are determined according to the Scientific Beta pay scale, based on qualifications and prior experience.
- Written and spoken English is essential, and basic spoken French is a plus.
- An EU work permit is mandatory for the positions in Scientific Beta's London and Nice offices.
For more information about Scientific Beta, please visit our website and our corporate YouTube channel.
Senior Business Development, Sales Manager Europe (London)
Based out of Scientific Beta's London office, the candidate will be expected to lead relationships with asset owners, consultants and Scientific Beta's strategic partners across Europe to proactively seek out opportunities to expand our market share and awareness in the index provider space. The candidate will have to introduce the Scientific Beta factor investing offering to the main investment industry market participants. The candidate will be expected to maintain a relationship with the Client Services Team based in France and Singapore and act as the "eyes and ears" of the support and R&D staff in France, while acting as a "customer advocate" to those parts of the Scientific Beta organisation. The candidate will also be expected to feed back knowledge about key investment trends to the marketing team, senior executives and the Group CEO.
The successful candidate should have excellent relationship building skills and proven experience in a business development role involving the sales of relatively complex equity products with proven capacity to achieve sales objectives. They must show the ability to develop and implement strategic and tactical territory account plans and a willingness to embrace cold calling approaches to open client dialogue and show the ability to win and close business. Solid experience and knowledge in the area of equity factor investing is required and ESG competency would be a plus. Experience of working within a quantitative research team with either an investment bank or asset management firm would also be an asset. The candidate should possess good presentational and written communication skills, together with evidence of the ability to work at decision-maker levels of management and be able to operate relatively independently, whilst working within a broader matrix organisation structure. They should have excellent organisational skills, an ability to work independently and will show initiative and involvement in the activities of the company, as well as diligence when carrying out tasks. The candidate should be willing to travel extensively within Europe as required and be a graduate of a business school or have a strong educational background in science, engineering and quantitative finance leading to financial skills and knowledge of financial securities, equities, index construction principles, and quantitative investment principles.
This is a global position that is based in London but requires frequent travel to Europe.
Quantitative Equity Analyst – Client Services (London or Nice)
The successful candidate will be a quantitative analyst with initial experience in quantitative equity portfolio construction and equity factor investing implementation if possible. The position requires a Master's degree in Finance or Financial Engineering from a leading institution and experience in constructing quantitative equity portfolios within an equity index provider, investment bank or asset manager.
The candidate will support the Client Services team in analysing and coordinating clients' requests (index simulations, index performance analyses including assessment of risk factor diversification and robustness, client reports) in cooperation with other internal teams (Research and/or Product Management).
Experience in drafting and publishing equity analysis reports for a broad audience in English is a must (excellent writing skills are crucial). The position also requires a strong analytical mind.
The candidate further needs to have a sound command of Matlab for financial computations, in particular in the area of portfolio construction and performance analysis.
Flexibility, responsiveness and team spirit are essential.

Scientific Beta
Scientific Beta aims to be the first provider of a smart beta indices platform to help investors understand and invest in advanced beta equity strategies. Established by EDHEC-Risk Institute, one of the top academic institutions in the field of fundamental and applied research for the investment industry, Scientific Beta shares the same concern for scientific rigour and veracity, which it applies to all the services that it offers investors and asset managers. On January 31, 2020, Singapore Exchange (SGX) acquired a majority stake in Scientific Beta. SGX will maintain the strong collaboration with EDHEC Business School, and principles of independent, empirical-based academic research, that have benefited Scientific Beta’s development to date.
The Scientific Beta offering covers three major services:
- Scientific Beta Indices
Scientific Beta Indices are smart beta indices that aim to be the reference for the investment and analysis of alternative beta strategies. Scientific Beta Indices reflect the state-of-the-art in the construction of different alternative beta strategies and allow for a flexible choice among a wide range of options at each stage of their construction process. This choice enables users of the platform to construct their own benchmark, thus controlling the risks of investing in this new type of beta (Smart Beta 2.0). Within the framework of Smart Beta 2.0 offerings, Scientific Beta provides access to smart factor indices, which give exposure to risk factors that are well rewarded over the long term while at the same time diversifying away unrewarded specific risks. By combining these smart factor indices, one can design very high performance passive investment solutions.
- Scientific Beta Analytics
Scientific Beta Analytics are detailed analytics and exhaustive information on its smart beta indices to allow investors to evaluate the advanced beta strategies in terms of risk and performance. The analytics capabilities include risk and performance assessments, factor and sector attribution, and relative risk assessment. Scientific Beta Analytics also allow the liquidity, turnover and diversification quality of the indices offered to be analysed. In the same way, analytics provide an evaluation of the probability of out-of-sample outperformance of the various strategies present on the platform.
- Scientific Beta Fully-Customised Benchmarks and Smart Beta Solutions
This is a service proposed by Scientific Beta, and its partners, in the context of an advisory relationship for the construction and implementation of benchmarks specially designed to meet the specific objectives and constraints of investors and asset managers. This service notably offers the possibility of determining specific combinations of factors, considering optimal combinations of smart beta strategies, defining a stock universe specific to the investor, and taking account of specific risk constraints during the benchmark construction process.
With a concern to provide worldwide client servicing, Scientific Beta is present in Boston, London, Nice, Singapore and Tokyo. As of December 31, 2019, the Scientific Beta indices corresponded to USD 59.2bn in assets under replication. Scientific Beta has a dedicated team of 52 people who cover not only client support from Nice, Singapore and Boston, but also the development, production and promotion of its index offering. Scientific Beta signed the United Nations-supported Principles for Responsible Investment (PRI) on September 27, 2016.
On November 27, 2018, Scientific Beta was presented with the Risk Award for Indexing Firm of the Year 2019 by the prestigious professional publication Risk Magazine. On October 31, 2019, Scientific Beta received the Professional Pensions Investment Award for "Equity Factor Index Provider of the Year 2019."
Contact

![]() Scientific Beta
Scientific Beta
1 George Street, #15-02, Singapore 049145
Tel. +33 493 187 851 (from 3.00am to 11.00pm CET)
E-mail: clientservices@scientificbeta.com | Website: www.scientificbeta.com